# Custom Analysis
Custom Analysis supports the flexible, multi-dimensional, and near-real-time analysis of user behaviors. Through customized reports, you can accurately follow the behaviors of users in the Mini Program, meeting the need for individualized analysis outside of standard statistics such as page visits. For example, an e-commerce Mini Program can be configured with a custom report to collect data and complete the following analysis:
- What is the age, gender, province, and city distribution of those who bought products? What are the differences in product purchasing quantity and price between different user groups?
- What is the conversion rate at each step in the process of users visiting a product page, checking product details, viewing comments, placing their orders, making payments, and completing the purchases? What are the differences of conversion rate between different user groups?
- How active were users that participated in today's online event over each hour?
# 1. Getting Started
Follow these steps when using Mini Program Custom Analysis:
(1) Clarify your data requirements (2) Define events and configure your report based on the product characteristics (3) Test and publish the event configuration and collect data (4) Analyze the data based on specific requirements
# 1.1 Clarifying Requirements
For example, an e-commerce Mini Program may need to analyze:
- The quantity of orders and their total amount in different regions
- The conversion and churn at every stage of the product purchasing process
# 1.2 Custom Event
Data is modeled after events for storage and analysis. In an e-commerce Mini Program, the process of a user making a purchase might include the following events:
- View Product
- View Details
- Add to Cart
- Place Order
- Pay
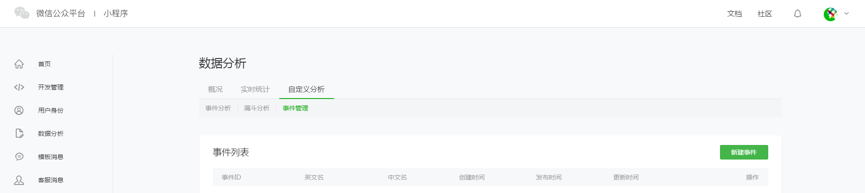
Log in to https://mp.weixin.qq.com, go to Data Analysis > Custom Analysis > Event Management, and click New Event.
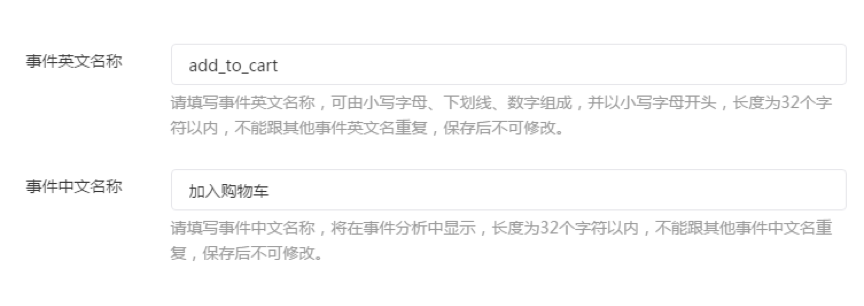
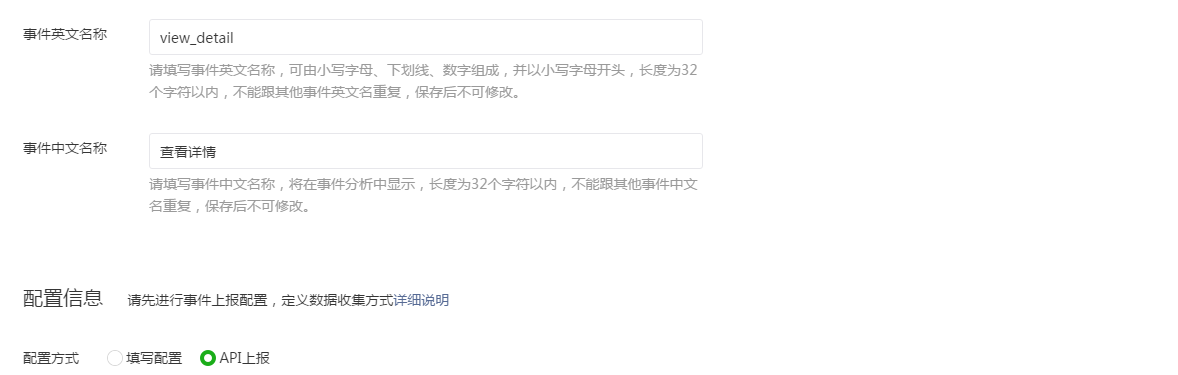
Using the event of Add to Cart as an example, enter the event's name (English & Chinese):
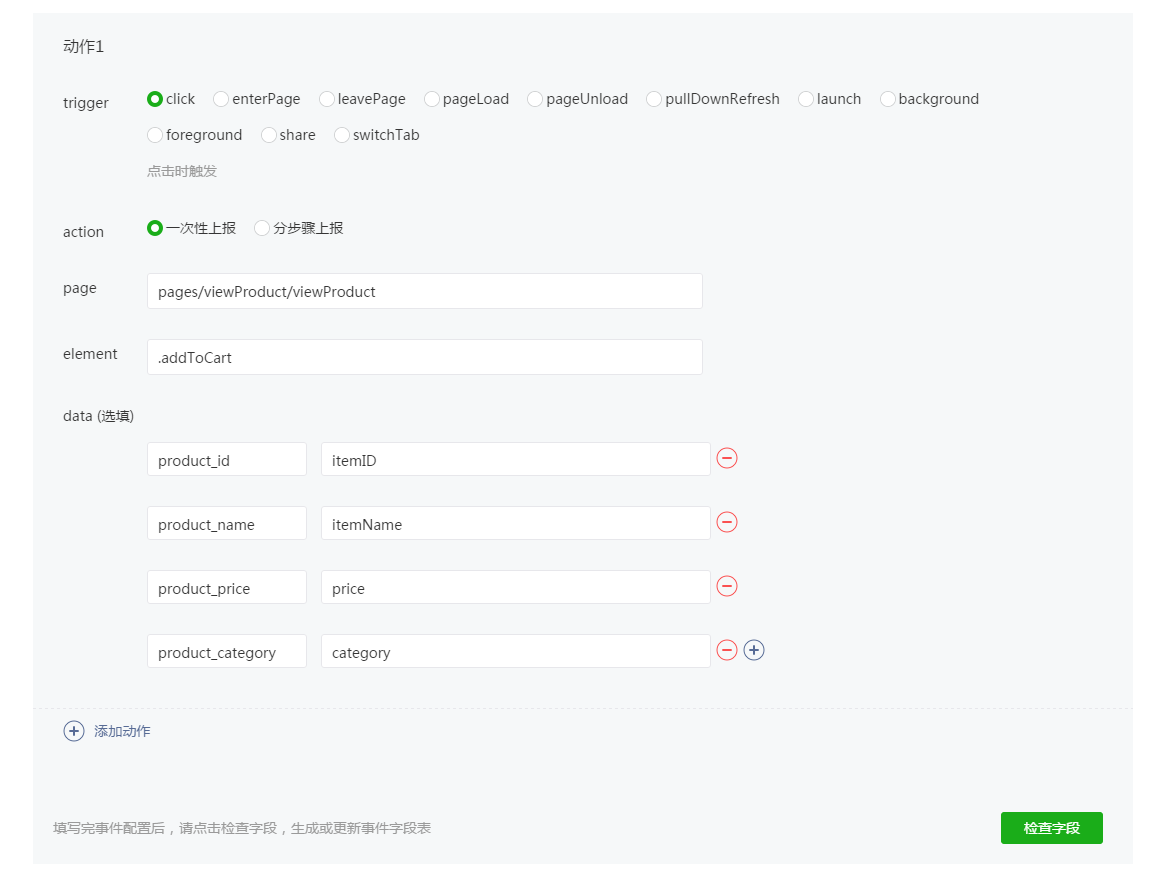
Enter the event configuration and define how to collect data:

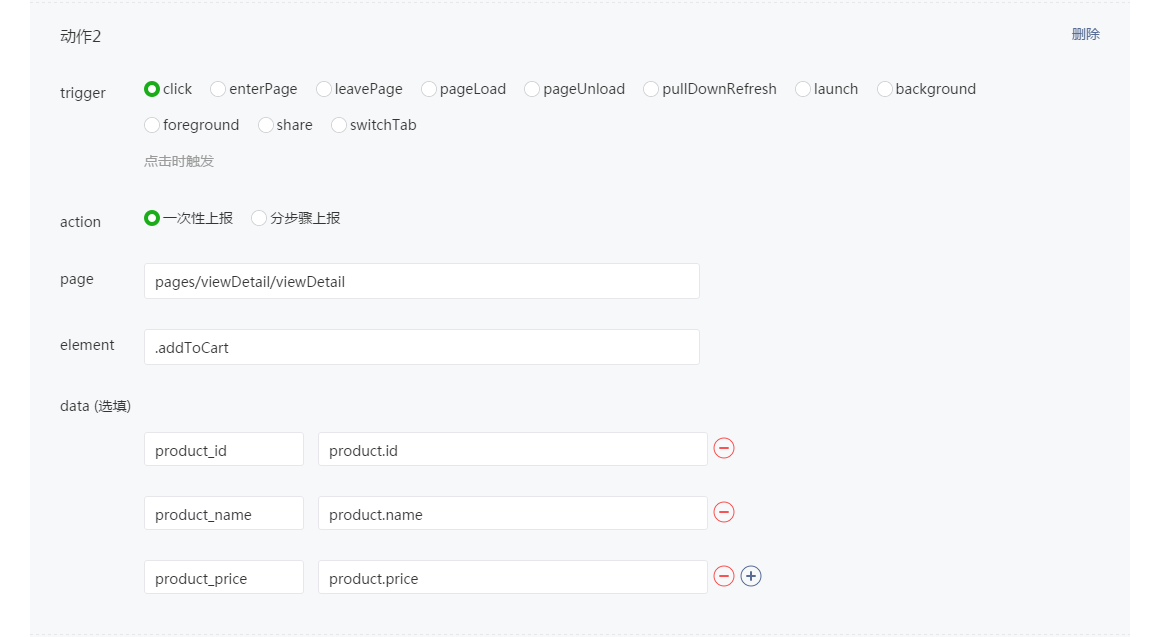
In this example, an action is used to report the Add to Cart event.
trigger: The trigger condition,
clickindicates that the event is triggered by clicking.action: The action taken when the event is triggered. One-off Report indicates that each
clickcollects and reports a piece of data.page: The trigger page. Enter
viewProduct(viewProductis the product details page).element: The trigger element. Enter
.addToCart(.addToCartis an "Add to Cart" button).data: The event data and source, indicated by "field name + field value". Its field value is a variable on the page.
In this example, there are four data items:
product_id: itemID
product_name: itemName
product_price: price
product_category: category
That is:
The
product_idfield of the event collects theitemIDfield of thepageinstance'sdataon theviewProductpage.The
product_namefield of the event collects theitemNamefield of thepageinstance'sdataon theviewProductpage.The
product_pricefield of the event collects thepricefield of thepageinstance'sdataon theviewProductpage.The
product_categoryfield of the event collects thecategoryfield of thepageinstance'sdataon theviewProduct page.
According to the above content, when the user clicks the .addToCart button on the viewProduct page, a record is reported to the add_to_cart event. The values of the event's product_id, product_name, product_price, and product_category fields are respectively itemID,
itemName, price, and category on the page.
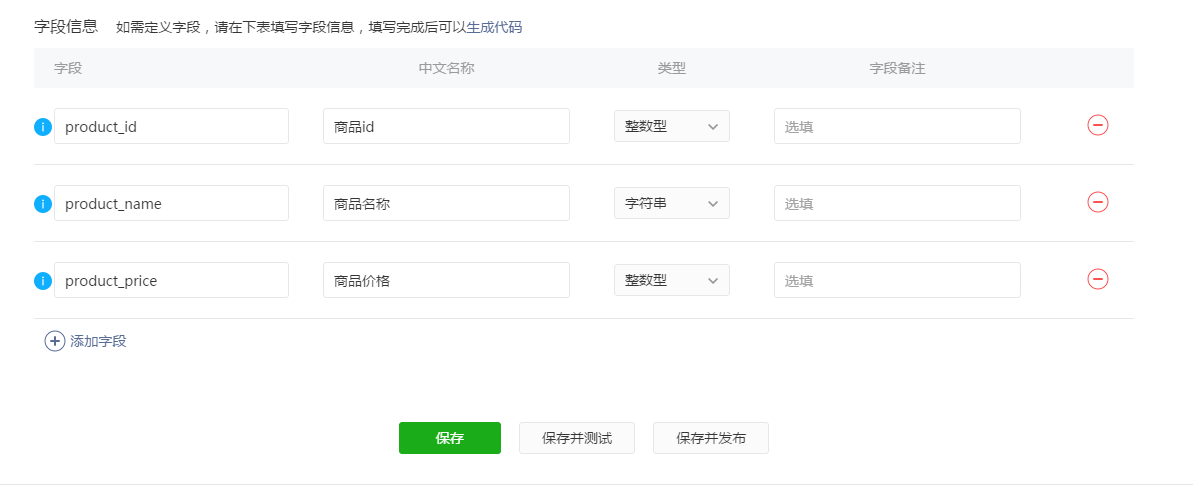
Once you confirm the configuration, click Check Fields.
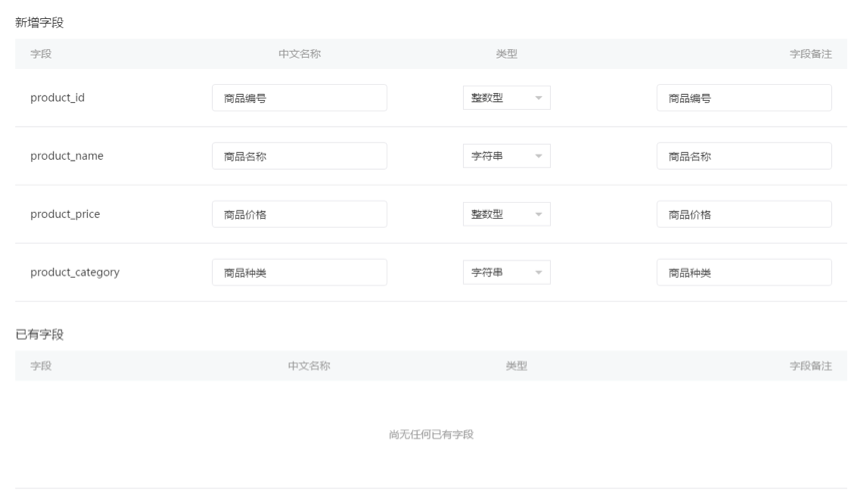
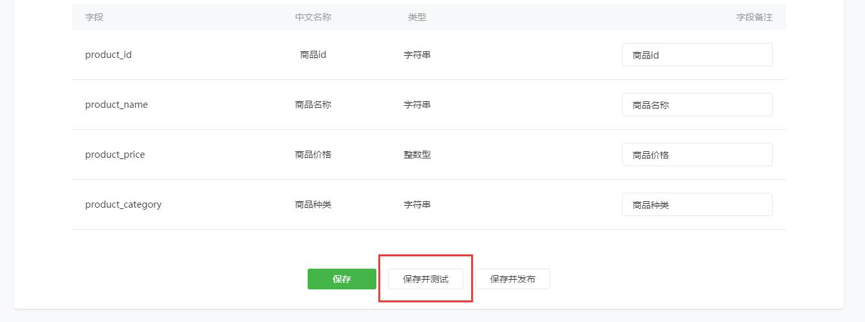
The specific fields of the add_to_cart event are displayed. You can add field names, data types, and notes.
# 1.3 Testing and Publishing

After you confirm the field information, click Save and Test to save the current configuration and test whether the reported data is as expected.

Select a developer, click Next, and the event configurations will be synced to the selected developer's device.

After the configurations are synced to the developer's device, follow the prompts on the device to open the appropriate Mini Program for testing. Click the Add to Cart button on the product details page for data reporting. After this operation is complete, click Sync Results. You may have to wait one or two minutes.

After the data is reported, you can view the report details in the current window. The test is successful if the data works as expected. Click Close to return to the event editing page.

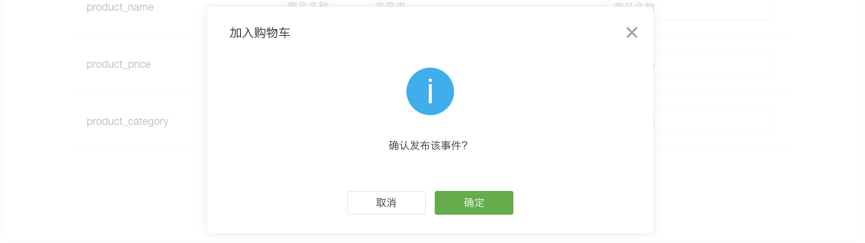
By clicking Save and Publish and confirming the publish operation, the event configuration takes effect. After about five minutes, you can start collecting the data from all users. Note: After the event is published, the names and data types of the event's existing fields cannot be changed, but you can edit the configurations and add new fields.
Similarly, you can define events like order placement and payment, publish their event configurations, and collect their data.
# 1.4 Data Analysis
After publishing the event configurations and collecting data, you can perform data analysis.
(1) Count the volume of orders from users in different cities
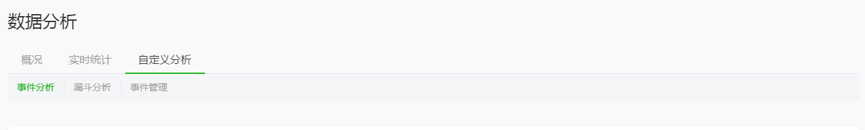
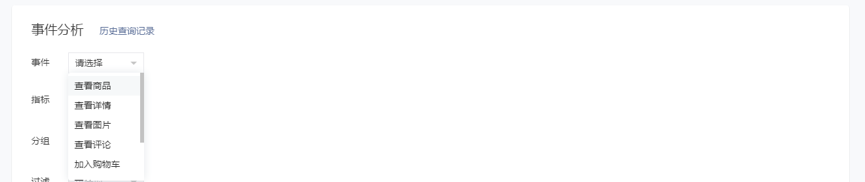
Go to Data Analysis > Custom Analysis > Event Analysis

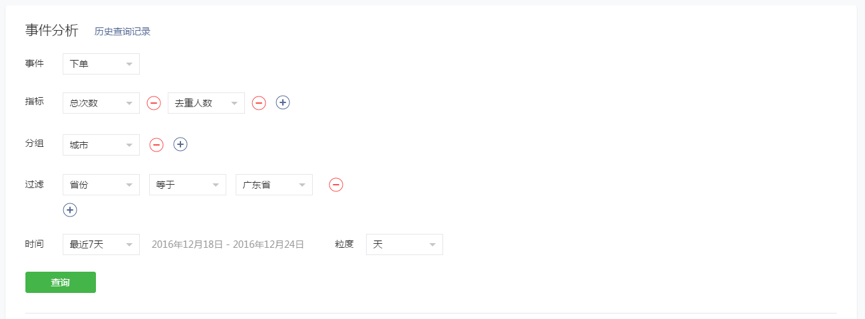
Event: Select Place Order.
KPI: Select Total Triggers and Unique Users, which indicate the number of orders placed and the number of users (after deduplication) placing orders, respectively.
Group: Select City to organize the orders and users by city.
Filter: (Optional) Select the filter conditions. For example, to only count data from Guangdong, select Guangdong as the province.
Time: Select a time range and granularity for the data. For example, you can view the data over the past seven days by day.
Then, click Query.
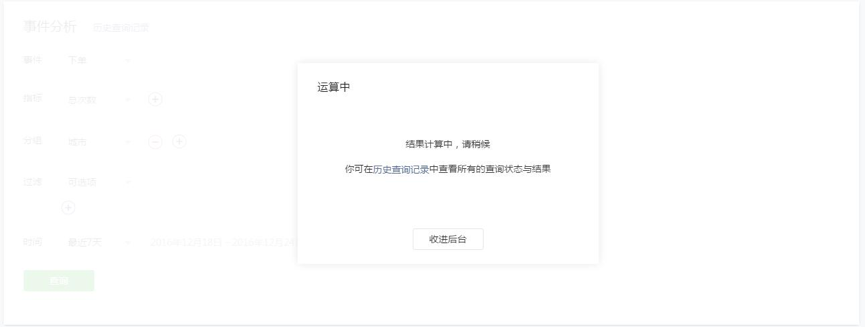
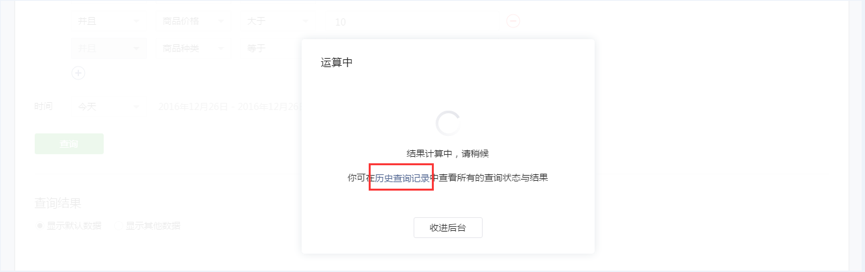
The data calculation starts, which may take some time depending on the amount of data. You can click Run in Background to perform a new query on the current page. You can also view the data recorded in your query history.
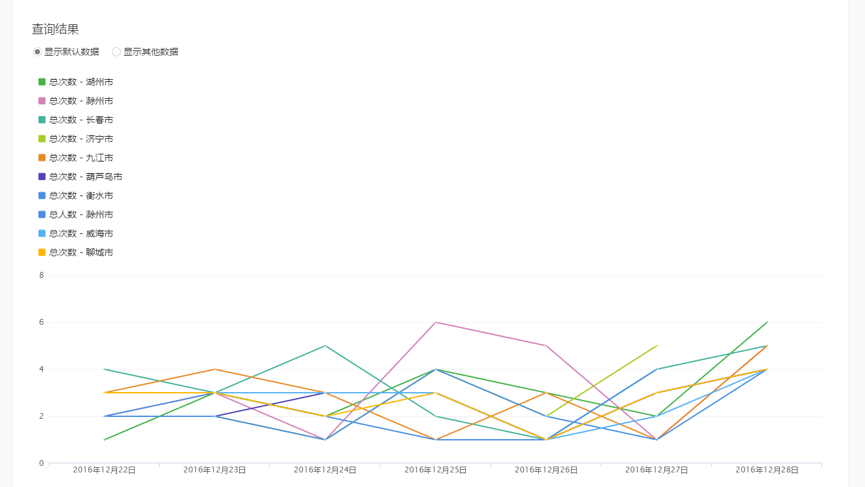
When the calculation is completed, the total number of orders and ordering users for each city are displayed on the current page. Due to the large number of groups, the chart only displays a portion of the data. You can configure Display Other Data to select the cities and KPIs that you want to see. The detailed data contains data for all cities and can be viewed or downloaded.
(2) The conversion and churn at every stage of the product purchasing process
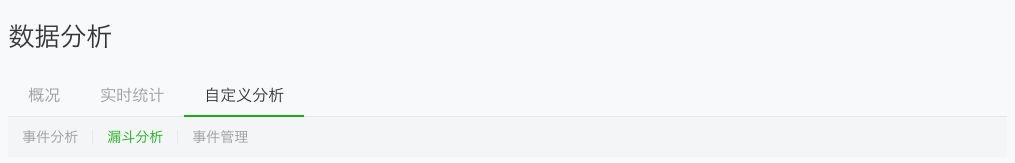
Go to Data Analysis > Custom Analysis > Funnel Analysis
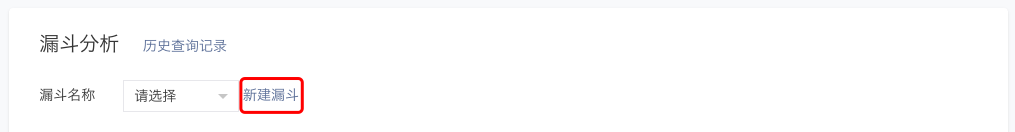
When you enter the Funnel Analysis module for the first time, click New Funnel to create a funnel.
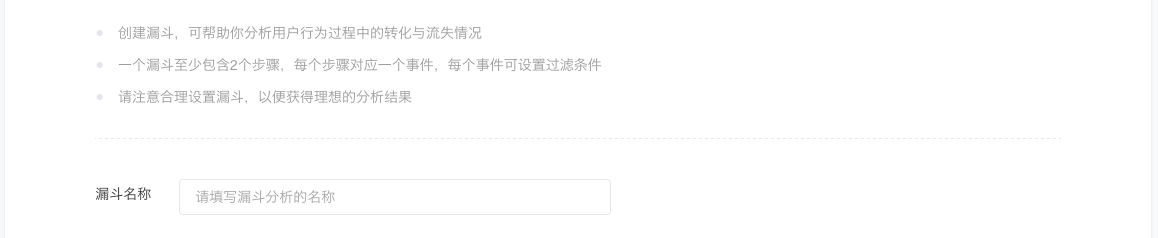
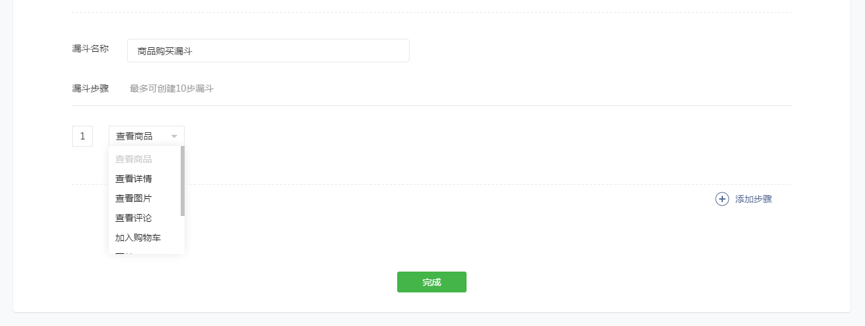
Enter the funnel name. Make sure it is concise and distinct to facilitate analysis.
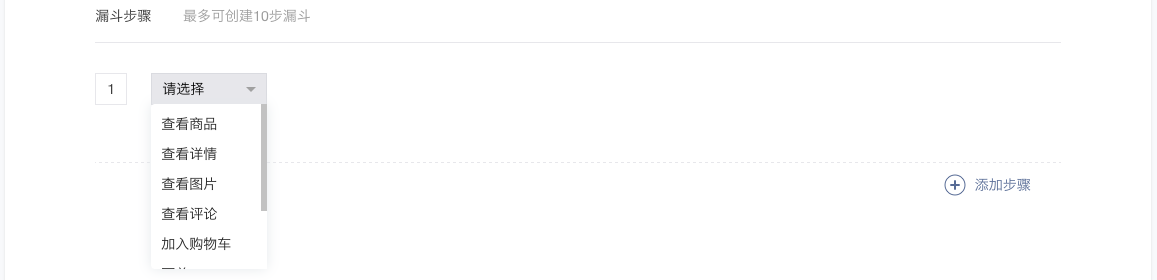
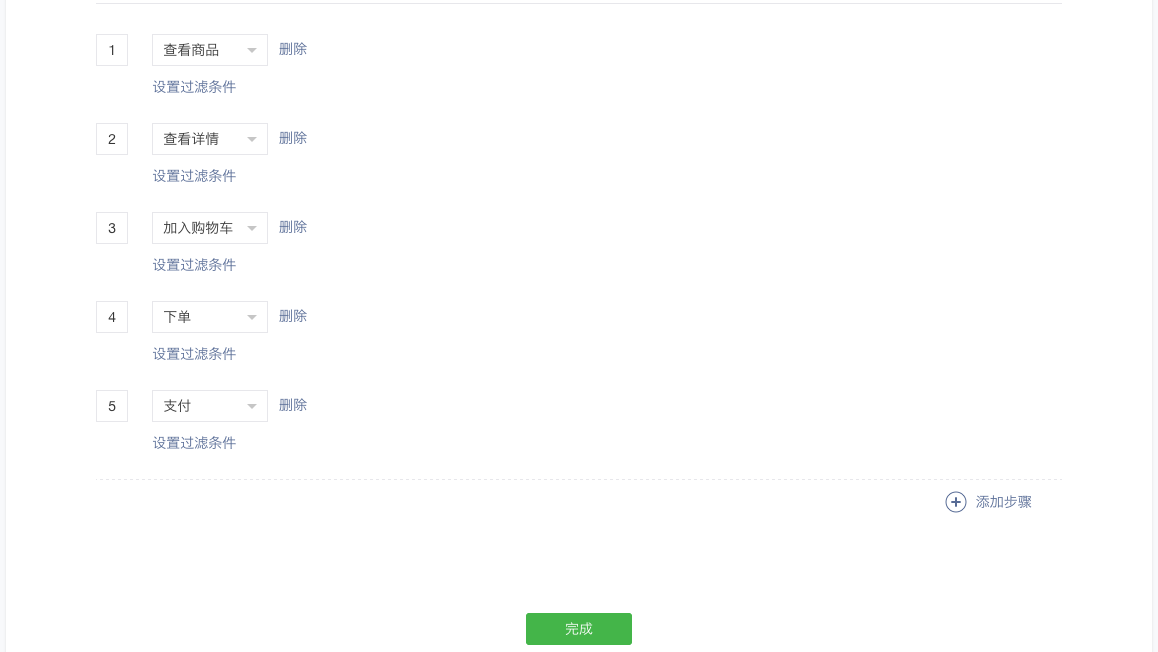
Set the funnel steps. Each step corresponds to an event. This funnel's steps are View Product > View Details > Add to Cart > Place Order > Pay. After each step is confirmed, click Add Step in the bottom right corner to add the next step.
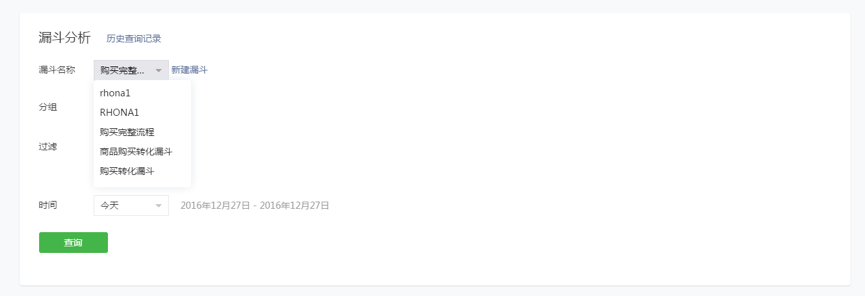
After all required steps are added, return to the data query page and set the query conditions.
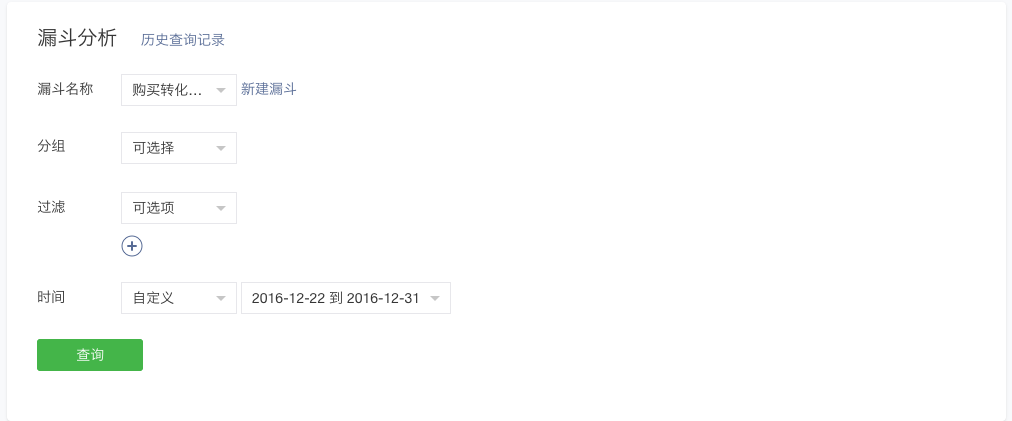
Funnel Name: Select the created Purchase Conversion Funnel.
Group: Select the fields that need to be calculated by group. The overall statistics are provided if no field is selected.
Filter: (Optional) Select the filter conditions. For example, to only count data from Guangdong, select Guangdong as the province.
Time: Select a time range over which the overall funnel conversion is calculated. Here you can select Dec. 22 to Dec. 31.
Click Query to view the data results.
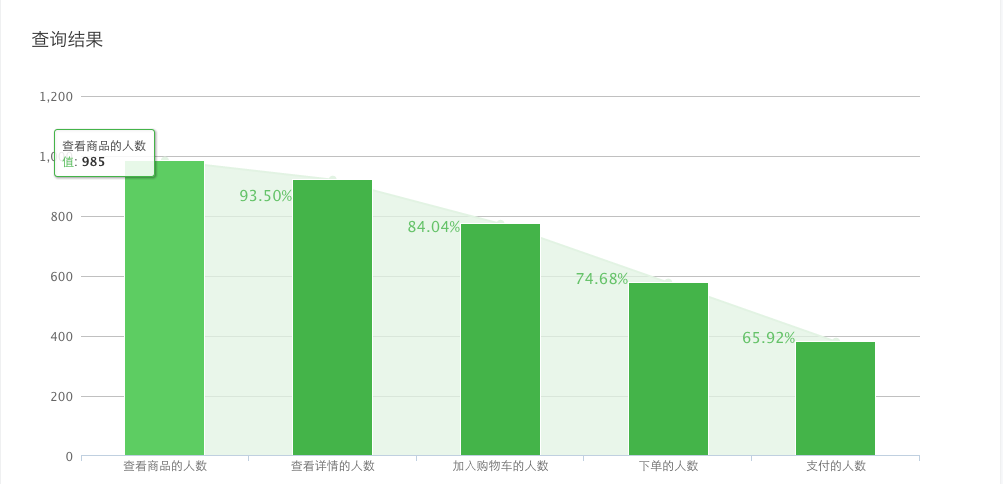
The chart shows that, from Dec. 22 to Dec. 31, the total number of people who viewed the product was 985. As these users progress through the steps, the conversion rate at each step is as follows: 93.50%, 84.04%, 74.68%, and 65.92%. The detailed data displays the specifics for each step and can be downloaded for viewing.
Furthermore, you can update the query conditions. For example, in the Group pull-down list, select the City field to view detailed funnel data for each city. Or you can set the filter conditions to only show the funnel conversions of a selected portion of users. You can also lengthen the time range to see the conversion and churn of users who viewed a product over a longer time period.
The above is a general introduction of how to use the Custom Analysis feature to analyze users' purchasing behaviors. The next section introduces the feature in more detail.
# 2. Event Management
# 2.1 Events and Fields
Event is a model used to collect and analyze user behavior data during custom analysis.
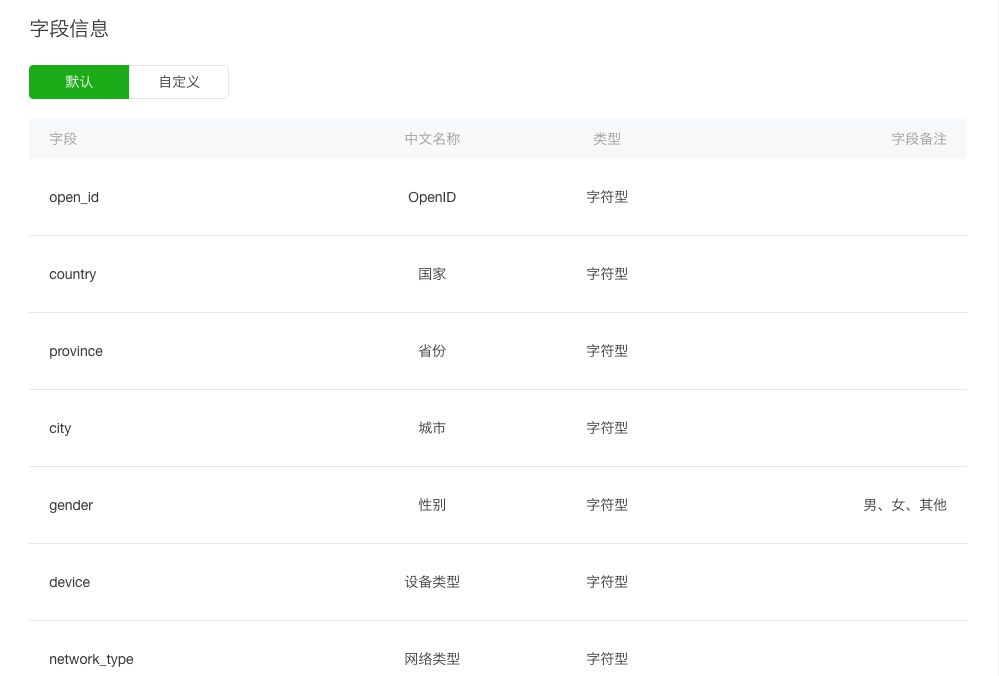
The data of an event is comprised of multiple fields, including system default fields and user-defined fields.
The data of system default fields are collected by the system, such as the user region and device type; while users specify the user-defined fields and collect their data.
Fields are defined globally. For example, if both event A and event B uses the field "a", then the definition and description of "a" are the same in these two events.
In Data Analysis > Custom Analysis > Event Management, you can view the system default fields and existing user-defined fields.
The field types support 32-bit integer type and character type input.
# 2.2 Event Editing and Publishing
You can use New Event to create an event and Modify to edit the event. Only after the event has been published does it take effect when collecting and analyzing data.
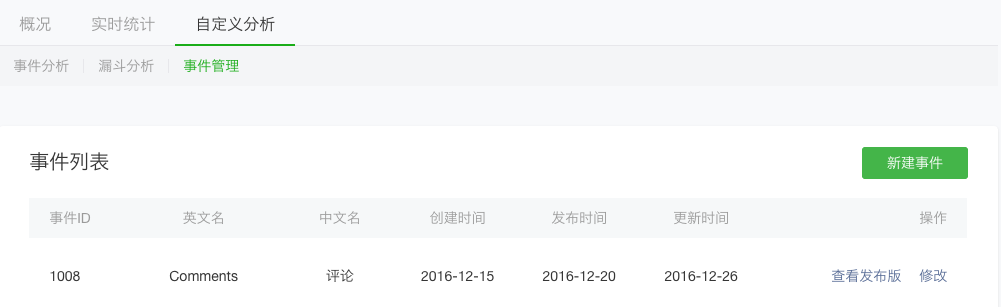
New Event: Add a new event.
View Published Version: See the latest official version of the event.
Modify: Edit the event.
# 2.2.1 Adding/Modifying an event
Click Modify to enter the event editing page and edit the existing event.
Or click New Event to create an event.
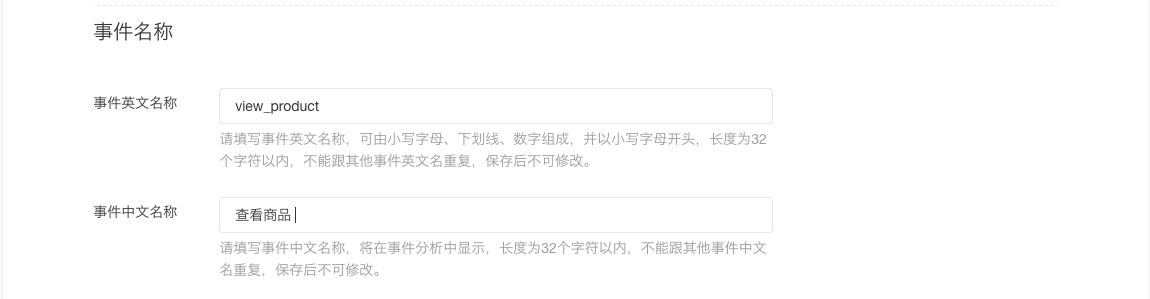
When adding a new event, enter the event's English and Chinese names.
The English name consists up to 32 characters that are comprised of lowercase letters, underscores, and numbers, and begins with a lowercase letter. While the Chinese name cannot exceed 32 characters. Both English name and Chinese name must be unique.
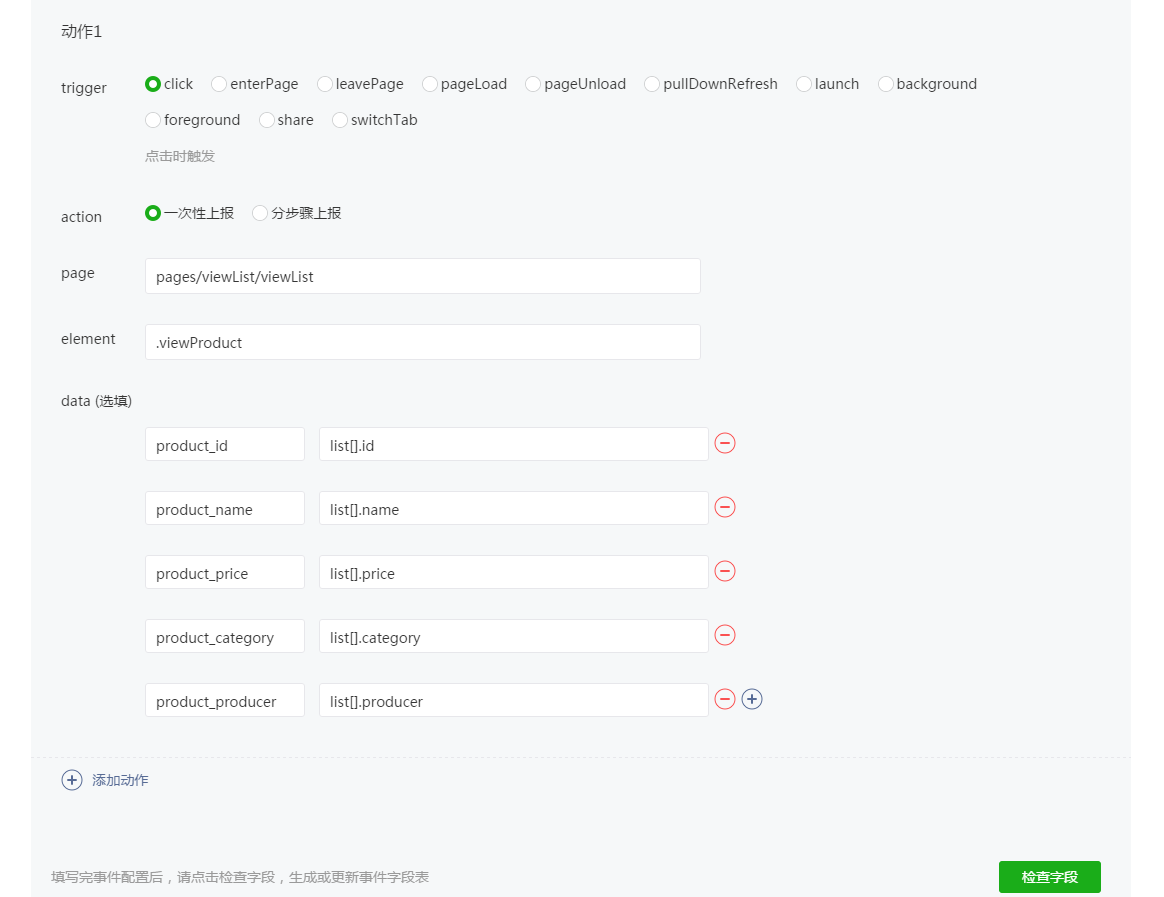
When editing an event, you must first edit the event configuration, such as how it collects data. For more details on configurations, see Event Report Configurations.
As the figure shows, in the view_product event, the fields product_id, product_name, product_price, product_category, and product_producer are used to collect the information on the page. If the view_product event has not used these fields before, they must be added to the event.
After editing the event configuration, click Check Fields to see which fields are specified in the report configurations and whether they need to be added to the event.
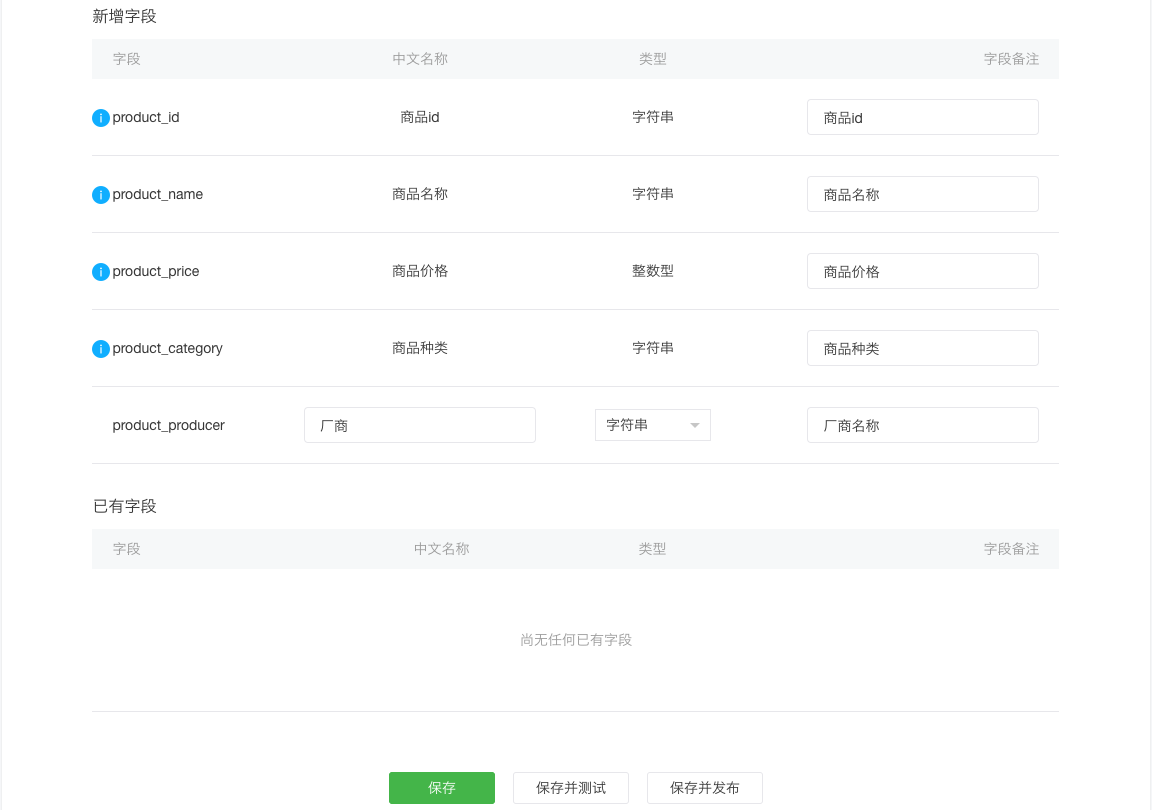
In the above figure, five new fields in this example have not been published or used by the event. Of these five fields, product_category, product_id, product_name, and product_price have been previously defined in other events, so their type and meaning are already determined (as mentioned before, fields are defined globally). However, product_producer has not been defined and requires additional information.
For details, see Event Fields.
After adding information to the field, click Save to save the changes.
Save and Test saves the current configuration and begins the testing process, allowing you to see whether the reported data is as expected. See [Event Testing Process] for more information.
Save and Publish saves and publishes the current configuration, enabling the event to start collecting and analyzing user behavior data.
# 2.2.2 Reseting to online version
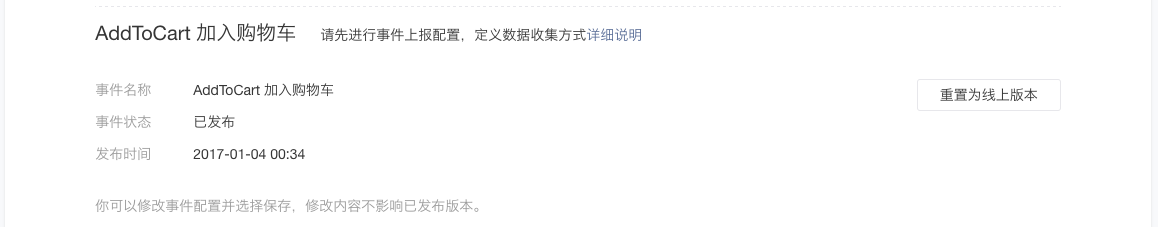
If the edited configuration does not meet your requirements, you can click Reset to Online Version to discard the changes.
Note that this operation does not trigger an auto-save. After clicking Reset to Online Version, you need to click Save again.
# 2.2.3 Event reporting methods
Event data can be collected by configuring event report or reporting via API.
An event can be reported by using either of two methods at a time.
# 2.2.4 Event report configurations
Each event needs to have a specified data collection method. This is managed through event report configurations.
Every event report configuration item is an action and can be composed of one or more actions.
Each item in an action is defined as follows:
trigger: The trigger condition.
click: Triggered by a click event. Page and element must be specified.enterPage: Triggered when entering a page, including opening a new page, returning to previous page, and switching to the foreground. Page must be specified.leavePage: Triggered when leaving a page, including exiting a page or switching to the background. Page must be specified.pageLoad: Triggered when opening a new page, meaning entering a page for the first time. Page must be specified.pageUnload: Triggered when reclaiming a page. Page must be specified.switchTab: Triggered when calling the switchTab API to switch to another page. Page must be specified.pullDownRefresh: Triggered by swipe-down-to-refresh. Page must be specified.launch: Triggered when loading the Mini Program.background: Triggered when switching to the background.foreground: Triggered when switching to the foreground.share: Triggered when sharing the page via the menu in the upper right corner.
action: The action used when the trigger condition is met. Data is collected by default, including system default data and user-defined data (defined in data). Data can be collected via one-off report or multi-step report, as defined below:
One-off report: A single trigger reports a single piece of data
Multi-step report:
Empty: Collect data onlystart: Initialize and collect datareport: Collect data and report event data
Note: Each report must be preceded by the start operation or the data will not be reported.
For an action, if One-off Report and click are selected, the sequence is as follows: click event > start > collect data > report.
page: The trigger page, such as pages/index/index and pages/list/list. This rule must be consistent with the pages field in the Mini Program's app.json. Enter ANY_PAGE for any trigger page.
element: The trigger element. It supports the id and class selectors of the first level css and must begin with . or #.
data: The collected custom data, from zero to multiple items. Each item is in the form of "field name + field value". If this is not entered, only system data will be collected.
Field name: The field name in the event
Event value: The data value of this field in the event. Mini Program variables can be collected according to the following rules:
The entered variable name is acquired from the data field of the page instance by default
To collect a data item from a list rendered by the list variables, use
list[].*in the field value. The array subscript is determined by a certain position on the NodeList obtained from the entered element (which can only be class).If the list is two-dimensional, use
list[][].*in the field value. Two classes (separated by a space) need to be entered for the element, representing the parent and child lists.To get the array subscript, use
list[].$INDEXin the field value.To get the values of data-* properties in wxml, use
$DATASET.*in the field value.To get the app instance data, use
$APP.*in the field value. Only the basic data can be obtained, such as number, string, and Boolean.
Apart from this, you can also enter some provided system properties, which start with "$". The following properties are supported:
$PAGE_TIME: The time from when the user enters the page to the current time (the time point when an action is triggered)$APP_TIME: The time from when the user enters the Mini Program to the current time (the time point when an action is triggered)$CURRENT_PAGE: The page the user is currently on$LAST_PAGE: The previous page
Note: data can be empty. In this case, the event report only collects the system default field data.
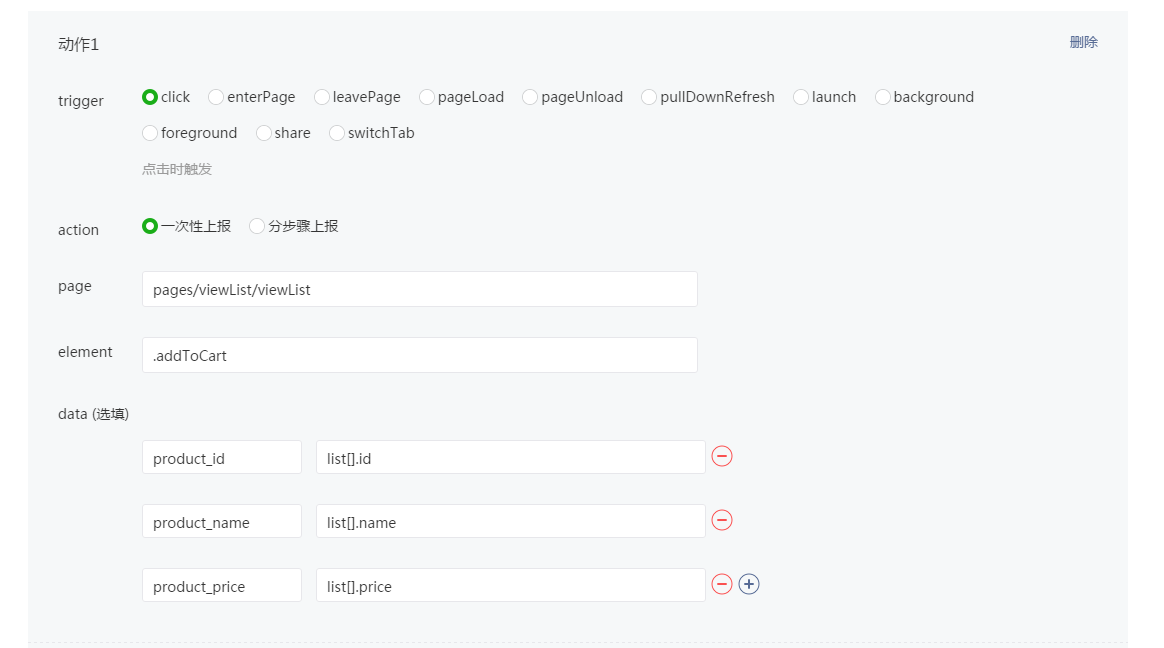
As above, when the view_product event is defined, there are the following fields:
product_id, product_name, product_category, product_price, and product_producer.
On the viewList page, clicking the viewProduct button reports the data.

Collecting data across multiple pages require more than one action for data report. For example, the product_id, product_name, and product_category data are collected from the viewList page, and then the product_price data is collected from the viewProduct page and reported.
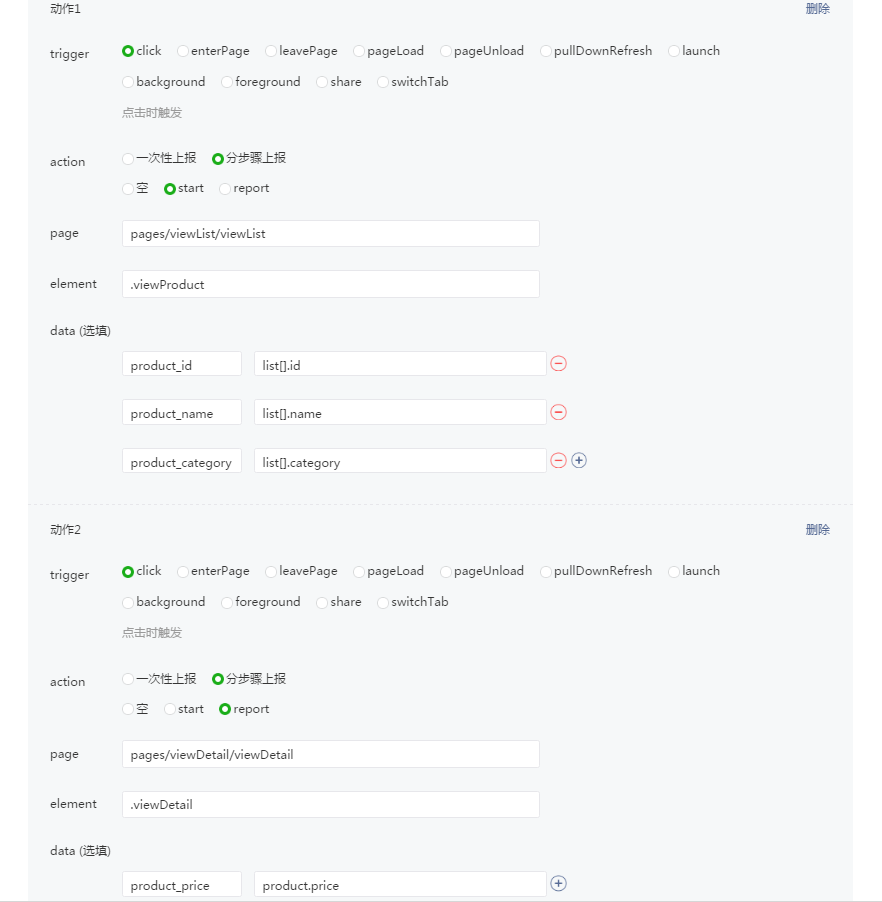
The viewList and viewDetail pages both have the .addToCart button and need to report the data to the "Add to cart" event, as shown in the example below:
# 2.2.5 Reporting data via API
In some situations, when the method of event report configuration cannot meet the report requirements, you can use the Mini Program API to report data.
Select Report via API in the event editing page.
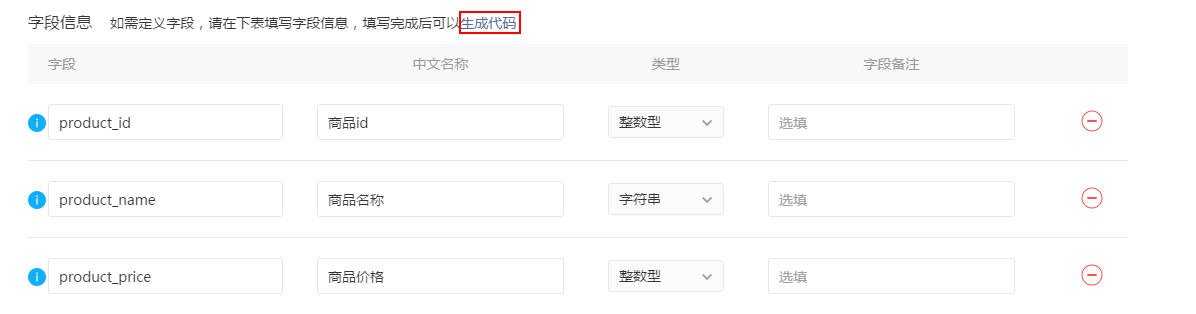
Add the fields as needed.
After confirmation, click Save and move on to the next step.
In the code, use the API to report data. For details, see wx.reportAnalytics.
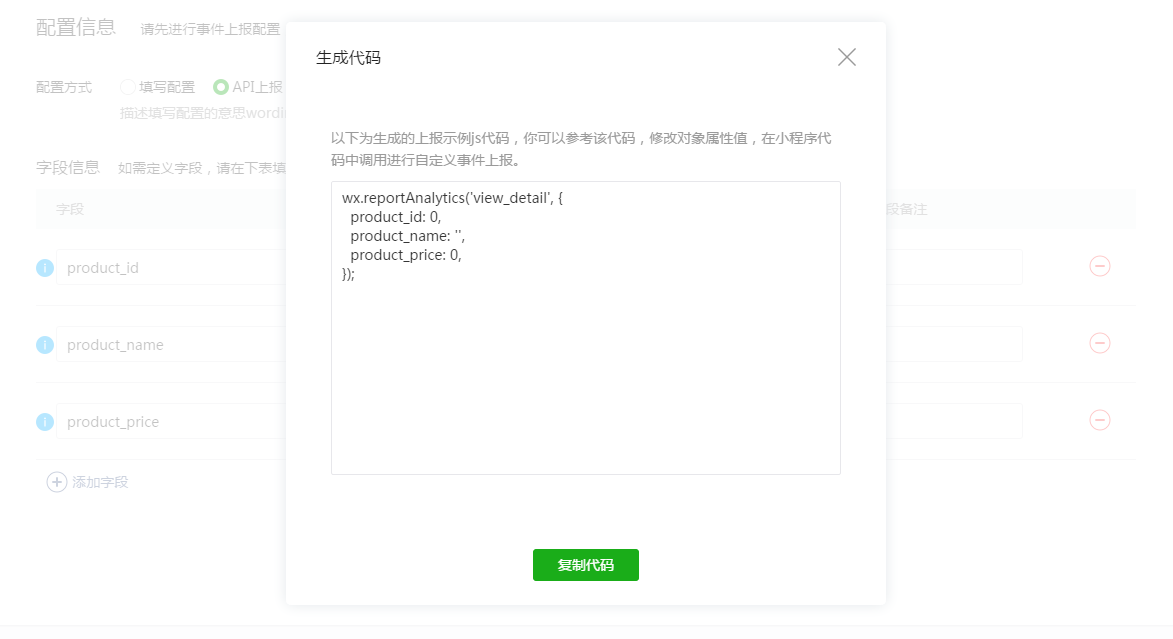
Click Generate code to generate sample code for reporting via API.
In the generated code, integer fields are 0 and character fields are "" by default and can be changed as needed.
Tips
- When you click Save and Test, the selected tester needs to use the developer version of the Mini Program to report data.
- The DevTools does not support Custom Analysis data reporting.
# 2.2.6 Event fields
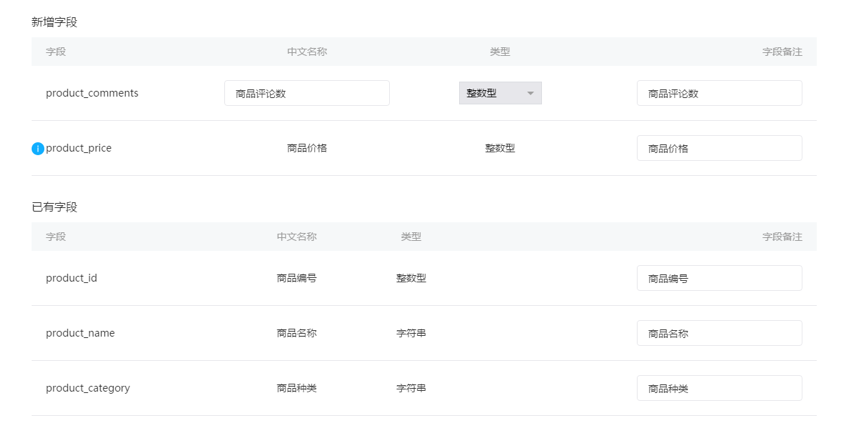
When entering event report configuration, you need to check the fields. See the figure below:
New Fields: New fields that need to be added to the event
Existing Fields: Fields that already exist in the published version of the event
You can only edit the field notes of existing fields, which take effect after publication.
For new fields, as shown in the example below, product_id has already been defined in another event and cannot be defined again when added to this event, but product_producer is a new field that requires definition. Enter the Chinese name and field notes to be displayed, as well as the field type, user data report, and data processing.
Icons may appear on the page to indicate that the new fields or existing fields are in the following statuses and require attention:
(1) A new field has been defined in another event
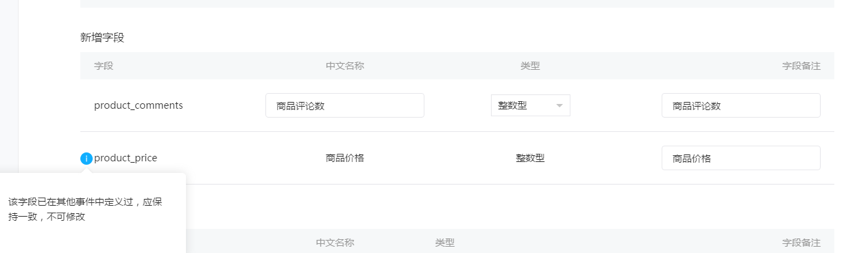
product_price is a new field but has already been defined in another event. After the fields is checked, you will be prompted: This field has been defined and cannot be changed.
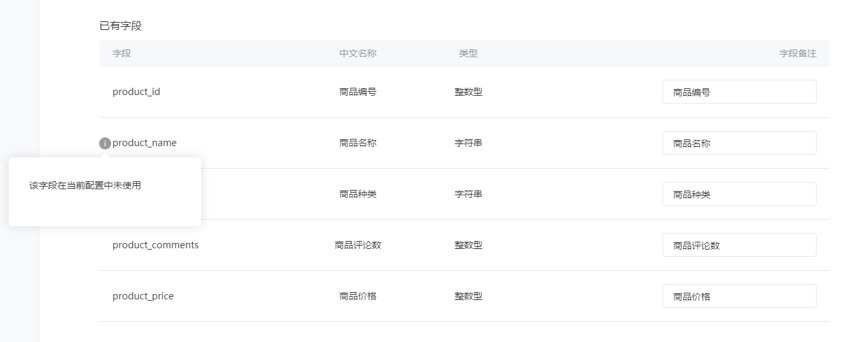
(2) An existing field has been removed from event configuration
As in the figure below, when editing an event configuration, an existing field is deleted from data in the event configuration:
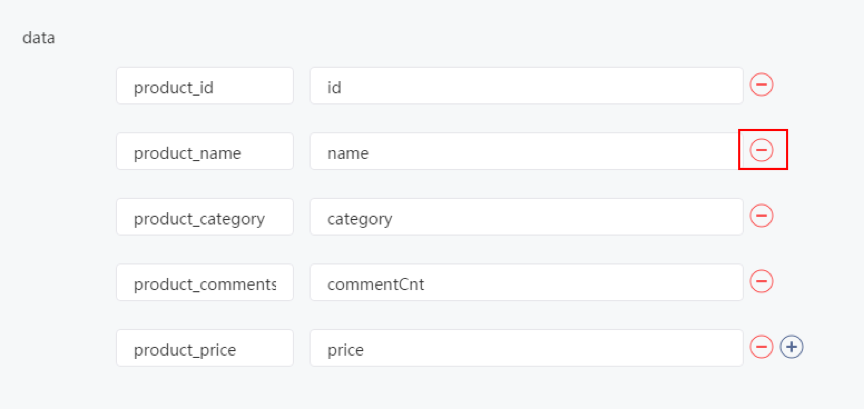
After the field is checked, you will be prompted: This field is not used in the current configuration, meaning that product_name will not be used to collect data.
(3) A suspended field is reused
If you add a deleted product_name field back into the data of an event configuration, product_name will continue to be used to collect data.
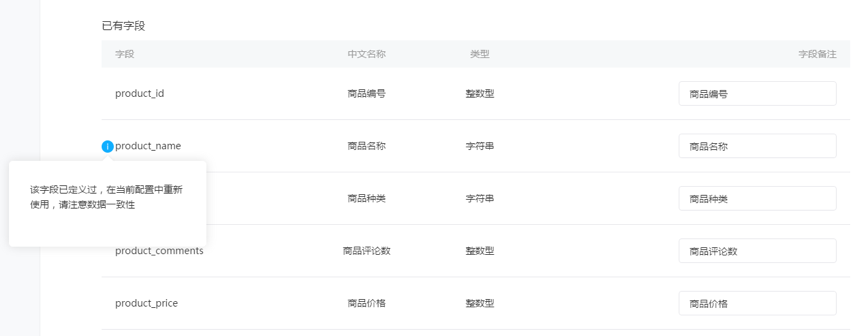
After the field is checked, you will be prompted: This field has already been defined. Note the data consistency if you reuse it in the current configuration. This means that product_name will be reused to collect data.
In this case, check whether the meaning of product_name is the same as before. If not, we recommend you use a new field. Otherwise, there will be a conflict between the data previously reported by product_name and the new data, interfering with the data analysis.
Field types
There are two field types: integer and string.
The integer type is 32 bit.
For integer data, if it is reported with a decimal point, the digits before the decimal point will be truncated by default. If the data is non-numerical, it will be reported as 0.
Fields are defined globally. A defined field can be added into other events.
# 2.3 Testing Event Configuration
After you confirm the field information, click Save and Test to save the current configuration and test whether the reported data is as expected.
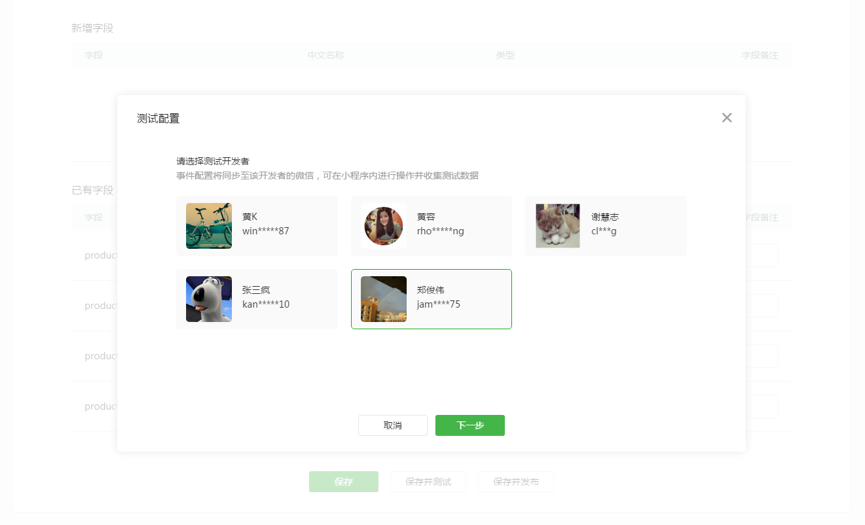
Select a developer, click Next, and the event configurations will be synced to the selected developer's device.
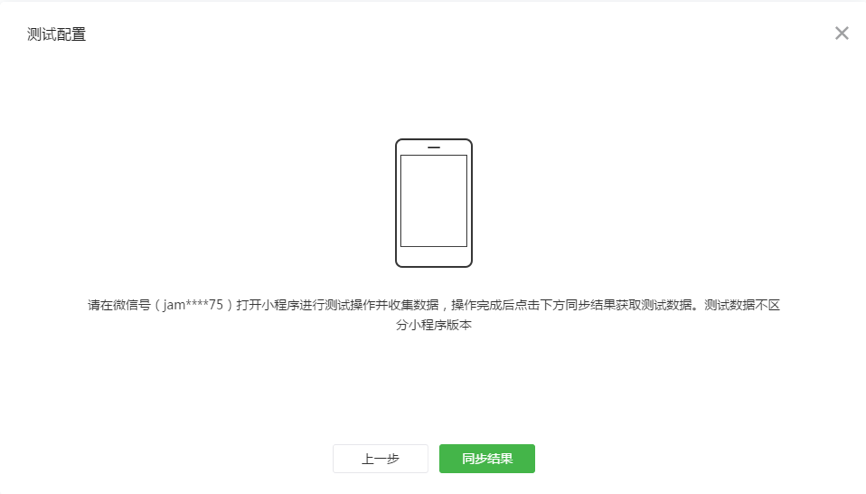
After the configurations are synced to the developer's device, follow the prompts on the device to open the appropriate Mini Program for testing. Click the Add to Cart button on the product details page for data reporting. After this operation is complete, click Sync Results. You may have to wait one or two minutes.
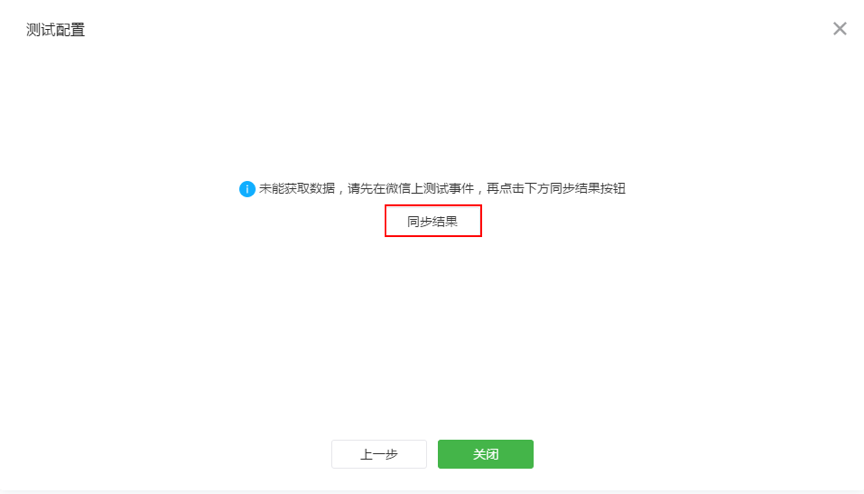
If no data is obtained, check whether the app version is 6.5.4 or above, whether you have performed the action correctly, whether the normal waiting time of 1-2 minutes has elapsed, and whether the app has a report log. After confirming there are no problems, you can click Sync Results again.
When inspecting the report log, you can enter the developer version of the Mini Program, click on the upper right corner to enable debugging, and then click the vConsole button after entering again to check the log.
When you start the Mini Program:
[Custom Analysis] Configuration pulled successfullyWhen syncing the configuration in the admin console page:
[Custom Analysis] Received latest configurationWhen the Mini Program reports data successfully:
[Custom Analysis] Reported successfully
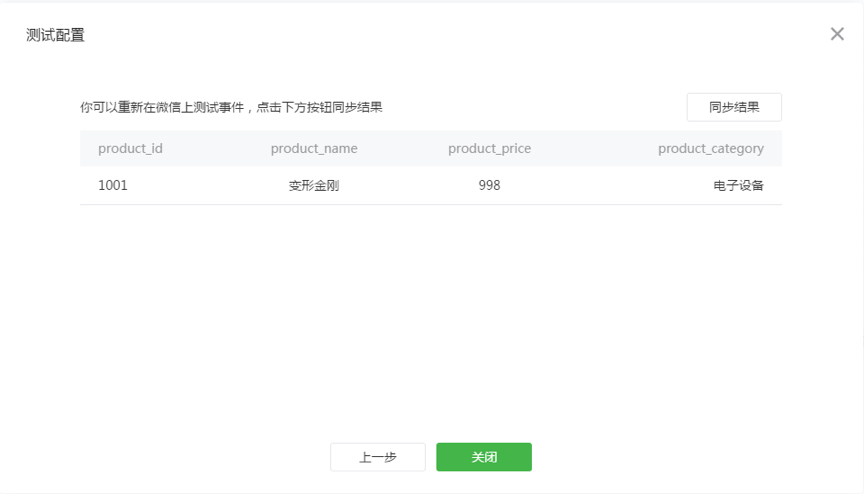
After the data is reported, you can view the report details in the current window. The test is successful if the data works as expected. Click Close to return to the event editing page.
# 2.4 Publishing Event Configuration
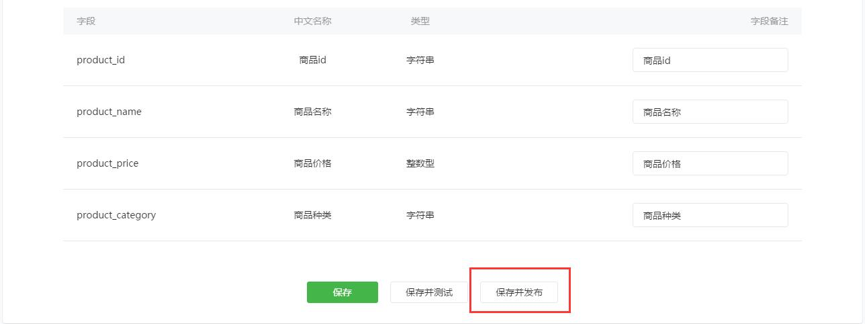
By clicking Save and Publish and confirming the publish operation, the event configuration takes effect. After 5-10 minutes, you can start collecting the data from all users.
Note: After the event is published, the names and data types of the event's existing fields cannot be changed, but you can edit the configurations and add new fields.
# 3. Event Analysis
# 3.1 Event Analysis Overview
Events are data collection and analysis models that correspond with user behaviors in the Mini Program, for example: registration, viewing a product, placing an order, and payment.
Event Analysis refers to query analysis based on event features, such as KPI calculating, property grouping, and condition filtering. For example, analyzing the Mini Program's number of registered users, product views, orders placed, the total amount of payments, and making comparisons across user groups.
Before carrying out event analysis, you need to define the event and configure the data to report and collect in Event Management. For details, see [Event Management].
When carrying out event analysis, you can flexibly select the query conditions and view detailed data results.
# 3.2 Event Analysis Query Conditions
# 3.2.1 Selecting an event
The event pull-down list displays all events created in Event Management. Only one event can be selected for each event analysis.
# 3.2.2 Selecting KPIs
Select the default or custom KPIs you want to analyze from the KPI pull-down list. Up to five KPIs can be selected for each analysis by clicking "+" on the right side to add a KPI.

Each event can calculate the following KPIs, which can be directly selected:
Total Triggers: The total number of times the event is triggered.
Unique Users: The number of unique users (determined by openid) who triggered the event.
Average Triggers Per User: The average number of times each user triggers the event, calculated as total triggers/unique users.
You can also select other KPIs to analyze based on the custom property fields in Event Management. You need to select the property field and the KPI to be calculated from the pull-down list. 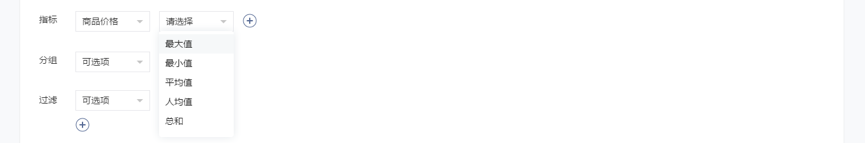
Different KPIs are available for the fields of various data types, as shown below:
| Field Type | Supported KPI |
|---|---|
| Character-type | Unique count (count(distinct)) |
| Integer-type | Sum (sum), maximum value (max), minimum value (min), average value (avg), and per capita value (sum/count(distinct OpenID)) |
For example, if product prices are integer types, you can select Sum of Product Price for the KPI.
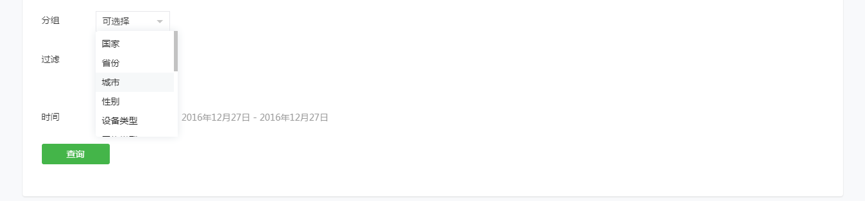
# 3.2.3 Selecting groups
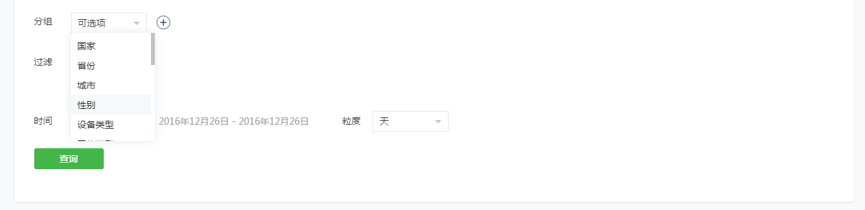
You can view data by selecting groups, including the system default properties and custom properties, in the group pull-down list. Up to five unique groups can be selected for each analysis by clicking "+" on the right side to add a group.
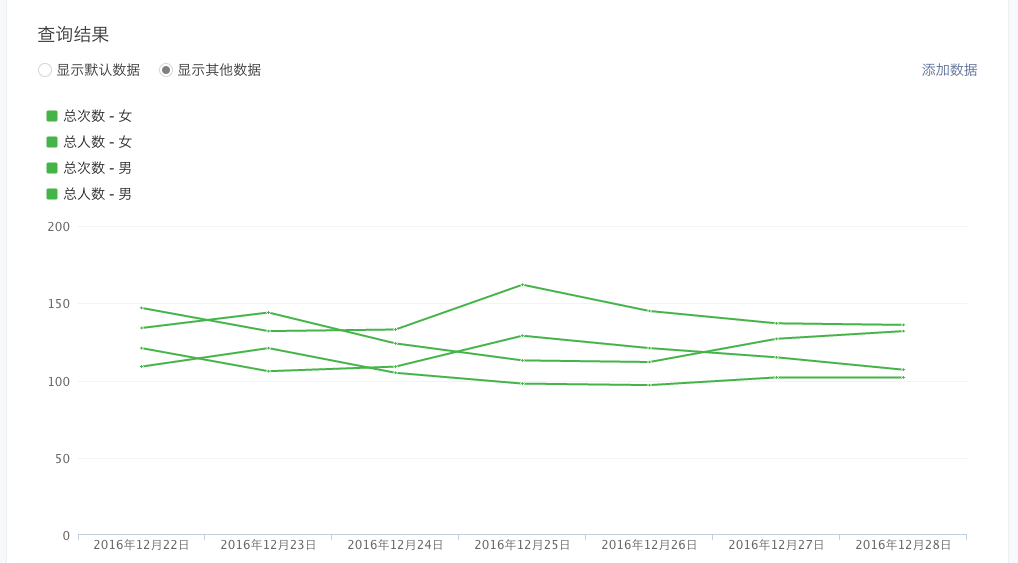
For example, you can select Total Triggers for the KPI and Gender for the group to calculate the total event triggers of male users and female users respectively.
Note: If you select too many groups, only a portion of the data will be displayed.
# 3.2.4 Setting filter conditions
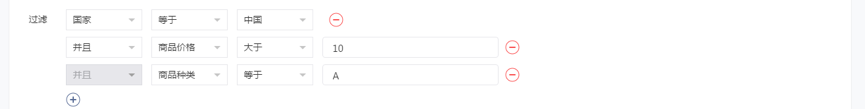
When analyzing an event, you can select or enter the filter conditions you want. Up to five filter conditions can be selected for each analysis. The relationship between conditions must be either "and" or "or". The former indicates that all conditions must be met, while the latter indicates that at least one condition must be met. If you change the relationship between any two conditions, the change applies to all conditions. You can add filter conditions by clicking "+" on the bottom.
The fields of different types correspond to different filter conditions, as shown below:
| Attribute Type | Supported Filter Conditions |
|---|---|
| System default field | Equal to/Not equal to |
| Character-type custom field | Equal to/Not equal to/With value/Without value/Empty/Not empty |
| Integer-type custom field | Greater than/Less than/Greater than or equal to/Less than or equal to/Equal to/Not equal to/With value/Without value |
For example: Select "Country Equal to China", "Product Price Greater than 10", and "Product Type Equal to A" to calculate data for product A in China with a price greater than 10.
# 3.2.5 Selecting a time range
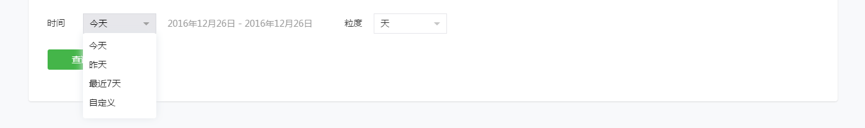
Select the time range for query analysis. Today, yesterday, past 7 days, and custom time ranges are supported. Data from the current day can also be viewed.
# 3.2.6 Selecting a time granularity
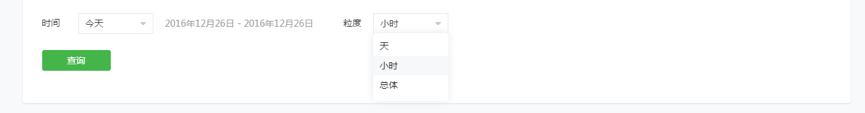
You can select the time granularity (Hour/Day/Overall) by which the data is queried. Selecting Overall displays the summarized data across all time ranges.
# 3.3 Viewing Event Analysis Results
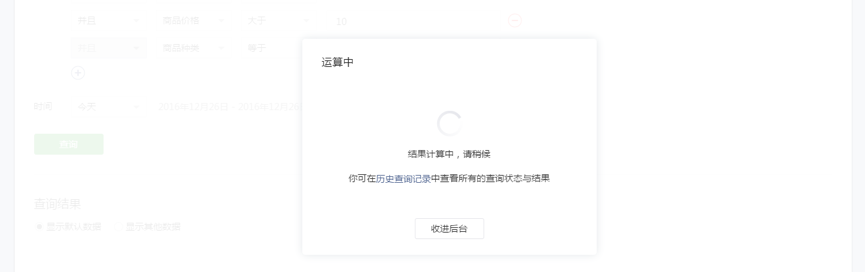
It may take some time to complete data calculation. You can wait on the current page, click Query History to view previous data, or click Run in Backgroundto make a new query.
# 3.3.1 Viewing chart
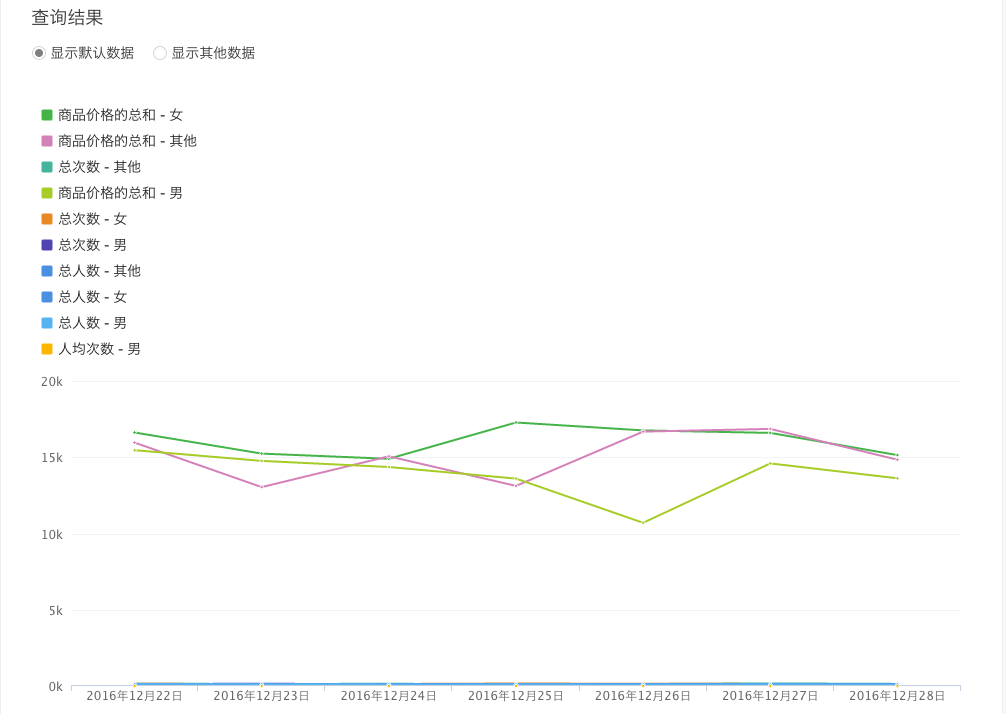
When the query conditions are too complicated, with too many KPIs and groups, the chart displays the 10 groups and KPIs with the greatest values by default. You can select the appropriate groups and KPIs to display.

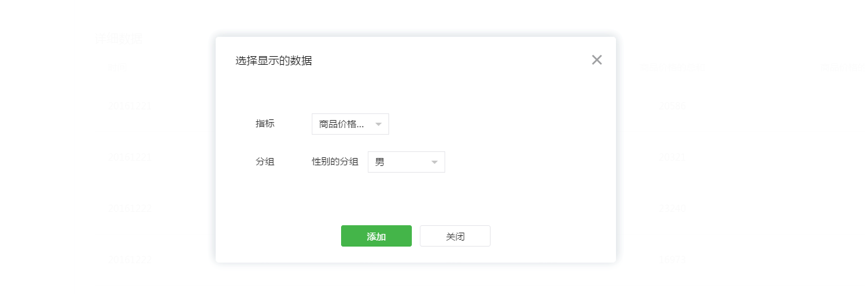
If the data you want to view is not displayed in the default data, you can click Display Other Data to select and compare the groups and KPIs that you want to view. Up to 10 can be selected.
# 3.3.2 Viewing details
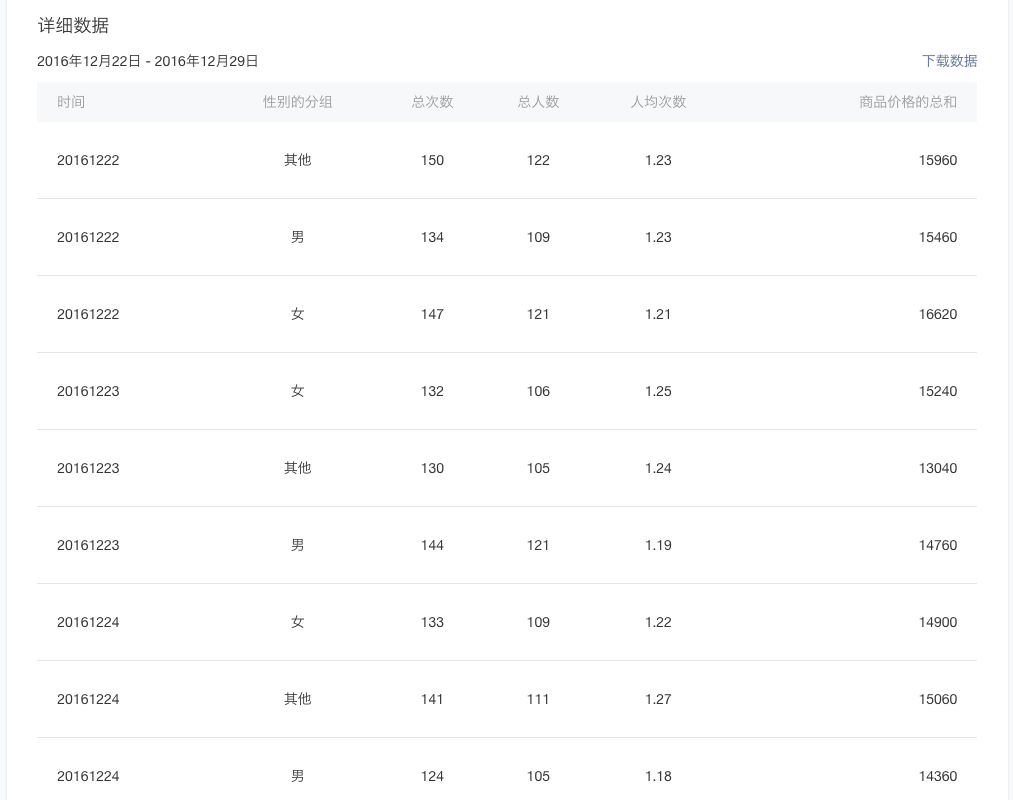
Detailed data is displayed across multiple pages, showing all groups and KPIs. The first column is time and the others are groups and KPIs. You can download the data results for further analysis.
# 3.4 Viewing Data Analysis History

When you are on the data query page or waiting for a query, you can go to the Query History page to view data from completed queries. All query results are saved for a period of time by default.
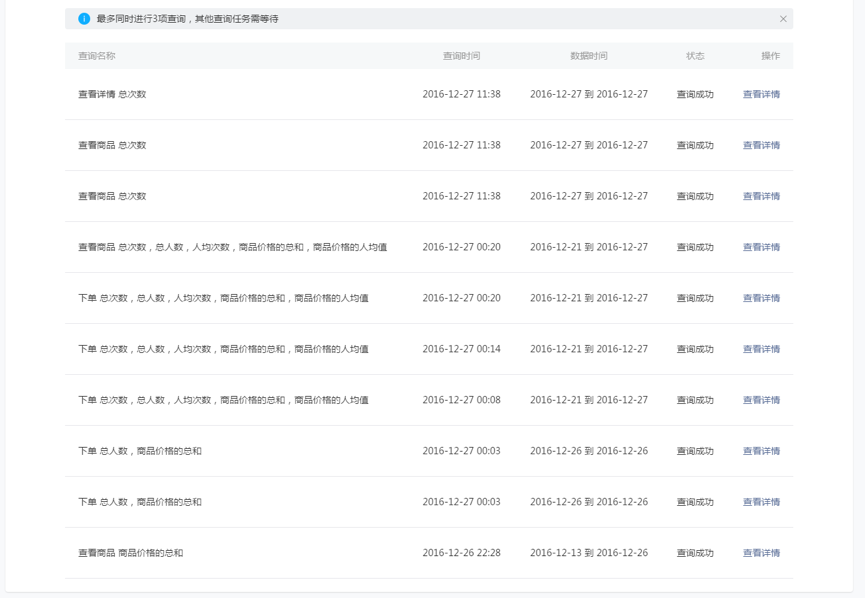
Query Name: The event and KPI names of the query.
Query Time: The time the query was executed.
Data Time: The time range of the queried data.
Status: The status of the query task, including Waiting, In process, Successful, and Failed. A maximum of three queries can be made at a time. When there are too many query tasks, they enter the Waiting status.
Operation: Go to View details to view the chart and detailed data of the query task.
# 4. Funnel Analysis
# 4.1 Funnel Analysis Overview
Funnel analysis means to connect multiple events and analyze user conversion and churn at each step. For example, the purchase process may involve the following steps (a step corresponds to an event):
- View Product
- View Details
- Add to Cart
- Place Order
- Pay
These steps can be set as a funnel to analyze the conversion and churn throughout the process.
Before carrying out funnel analysis, you need to define the event and configure the data to report and collect in Event Management. For details, see [Event Management].
When carrying out event analysis, you can flexibly select the query conditions and view detailed data results. Combine filtering, grouping, and other features for in-depth comparison and analysis.
# 4.2 Creating a Funnel
The first time you enter Funnel Analysis, you need to create a funnel.
# 4.2.1 Funnel steps
When you create a funnel, each step corresponds to an event. Each event can only appear once in a single funnel.
# 4.2.2 Filter conditions

You can set up filter conditions for the custom fields of each event in the funnel. The filter rules for funnel analysis are the same as those for event analysis. For example, if you want to analyze data for product A's purchase conversion rate, you can set the filter condition to "Product Type Equal to A".
# 4.3 Funnel Analysis Query Conditions
# 4.3.1 Selecting a funnel
Select the funnel you want to analyze from the funnel name pull-down list. Only one funnel can be selected for each analysis.
# 4.3.2 Selecting groups
The group pull-down list displays all of internally defined properties. You can select the group properties to be analyzed. Only one group can be selected for each analysis. The overall data is calculated if no group is selected.
# 4.3.3 Setting filter conditions
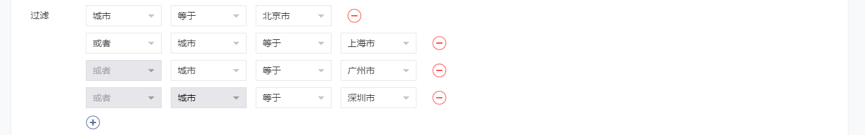
When analyzing an event, you can select or enter the filter conditions you want. Up to five filter conditions can be selected for each analysis. The relationship between conditions must be either "and" or "or". The former indicates that all conditions must be met, while the latter indicates that at least one condition must be met. If you change the relationship between any two conditions, the change applies to all conditions. You can add filter conditions by clicking "+" on the bottom.
For example: For the city, selecting Beijing, Shanghai, Guangzhou or Shenzhen calculates the data for these four cities simultaneously.
# 4.3.4 Selecting a time range
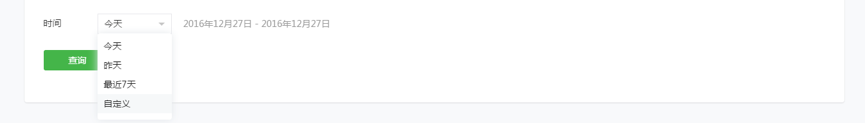
Select the time range for query analysis. Today, yesterday, past 7 days, and custom time ranges are supported. Data from the current day can also be viewed.
# 4.4 Funnel Calculation Rules
Within a selected time range and under the filter and group conditions, funnel analysis calculates the number of users (overall or within each group) who complete each step, from the beginning to the end of the process.
Step filter condition: Set for each step and valid for that step. For example, if the "Pay" step sets the filter condition "Payment Amount Greater than 500", then "Pay" and all steps afterward will only contain users whose payment exceeded 500.
Funnel filter condition: Valid for each step in the funnel. For example, if you set the filter condition "Province Equal to Guangdong", only the number of users with the province property of "Guangdong" will be calculated at each step.
Group conditions: Grouping by user properties and system properties are provided at early stage and valid for each step in the funnel. For example, if the group is set to City, then the funnel data in the Guangzhou group will be the data calculated at each step for users with their city set to Guangzhou.
Time range: The time range in which part or all of the funnel is applied. At least the first step is in this time range.
For example, if the funnel includes the three steps A-B-C, then the number of users and conversion rate are displayed as follows:
Number of users at step 1: The number of users who completed A within the selected time range and satisfied the group and filter conditions.
Number of users at step 2: The number of users who completed A-B in order within the selected time range and satisfied the group and filter conditions. If other operations are carried out between A and B, for example, A-C-B, this still satisfies the A-B order condition and is counted.
Number of users at step 3: The number of users who completed A-B-C in order within the selected time range and satisfied the group and filter conditions. If other operations are carried out between A, B and C, for example, A-D-B-B-C, this still satisfies the A-B-C order condition and is counted.
Conversion rate: The ratio between each step's number of users and the previous step's number of users.
# 4.5 Viewing Funnel Analysis Results
# 4.5.1 Viewing chart
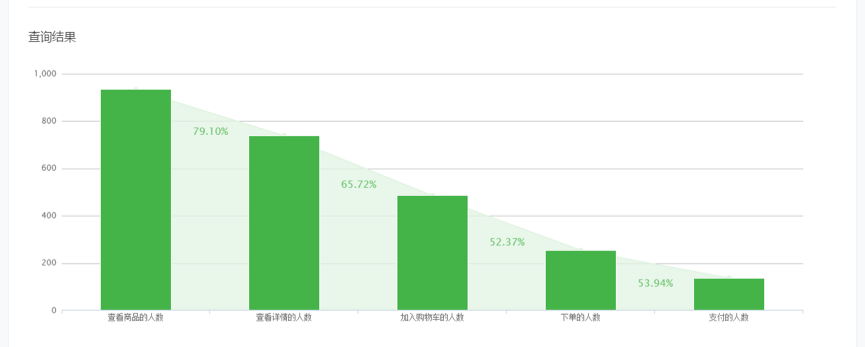
The chart displays the total number of users at each step in the funnel, as well as each step's conversion rate relative to the previous step.
# 4.5.2 Viewing details
Detailed data displays the number of users at each step in the funnel. If groups have been set, they are also displayed. You can download the data results for further analysis.