# Overview
# Yesterday's Overview
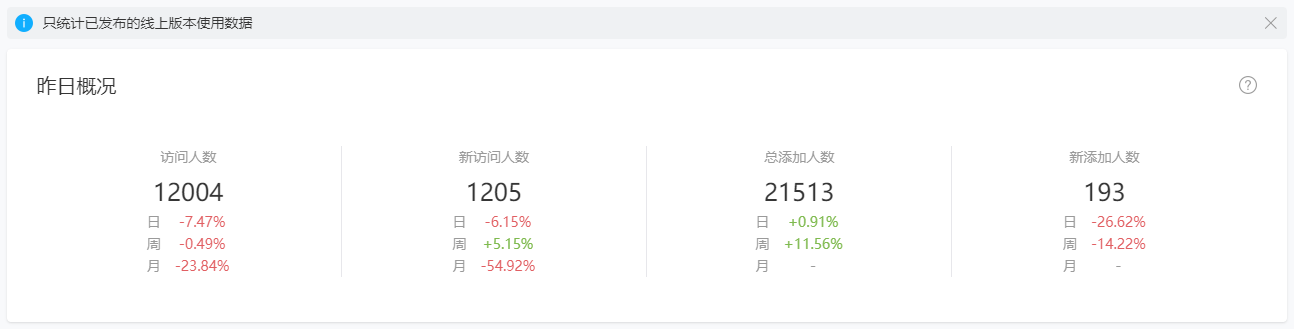
View yesterday's user KPIs, which provide a summary of the Mini Program's user activity, and compare the growth with the previous day, week, or month.
# Trend Overview
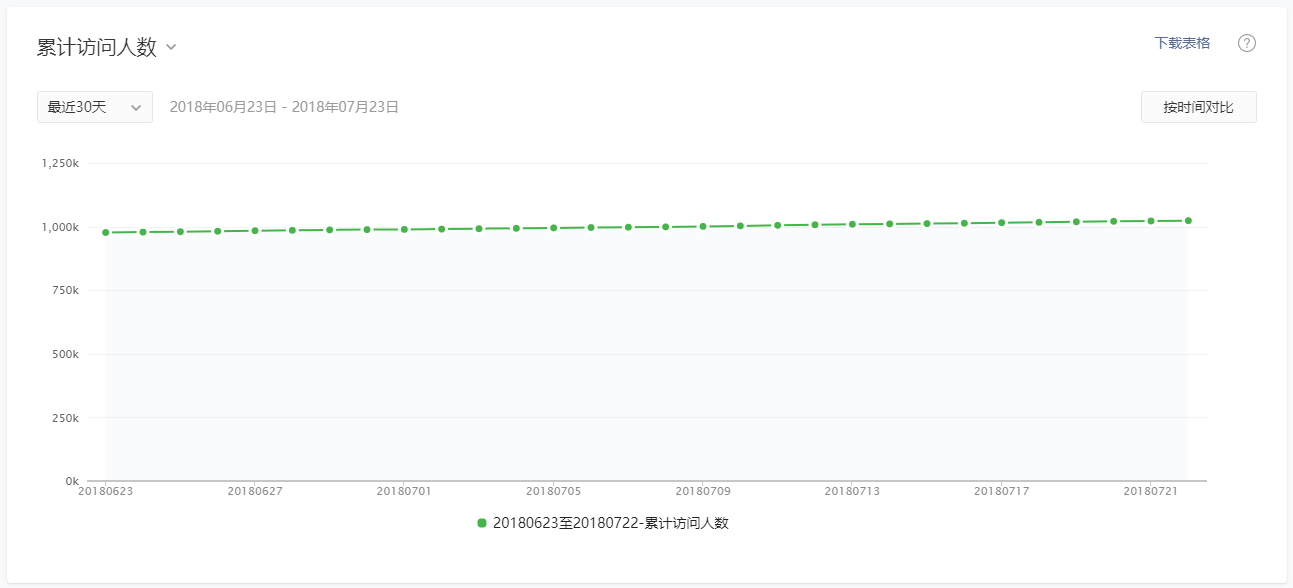
View the trends of KPIs, including unique users, opens, visits, unique visitors, new users, total adds, new adds, shares, sharing users, average stay per user, average stay per visit (see [Glossary - KPI]), and make comparisons by selecting different time ranges.
# Top Screens
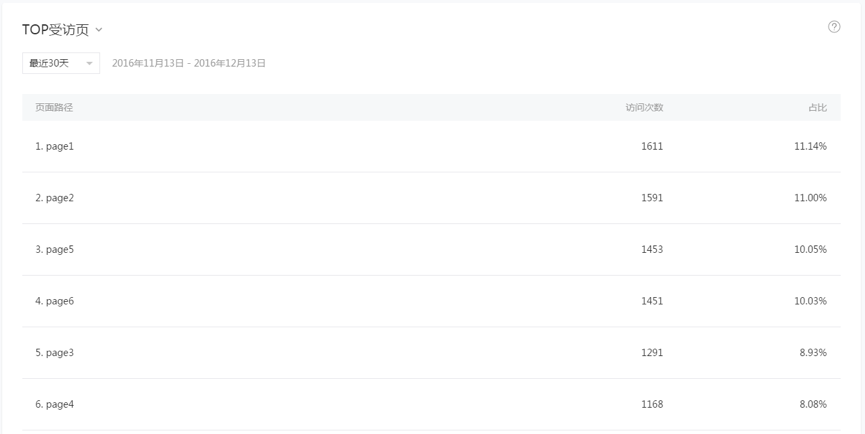
View the screens most frequently visited by users, along with their number of visits and its proportion of the total visits (single screen visits/total visits). Screens include landing screen and visited screens. A landing screen refers to the first screen visited by the user when entering the Mini Program, and a visited screen refers to any screen that users have visited.
# Real-time Statistics
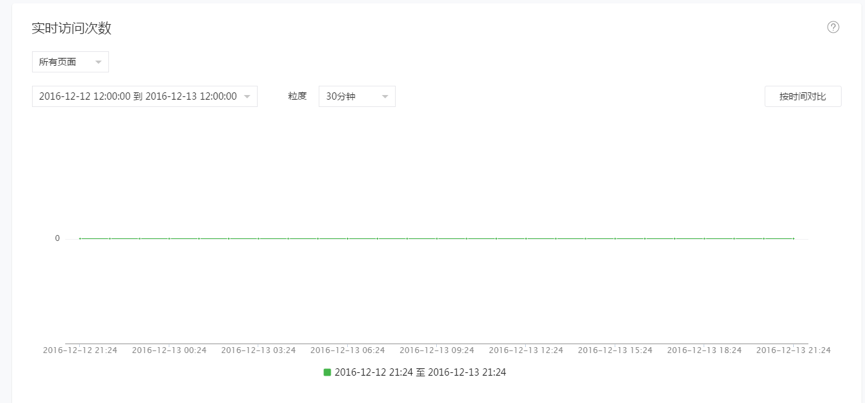
This feature allows you to view real-time user visit data. You can select to analyze all screens or a single screen and can select the time granularity (1 minute, 5 minutes, 10 minutes, 30 minutes, and 1 hour) to make comparisons by time. To more easily view data trends, select an appropriate time range when a minute granularity is used.
For detailed data, you can view the total visits and visit proportion of each screen within your selected time range.
# Visit Analysis
# Visit Trends
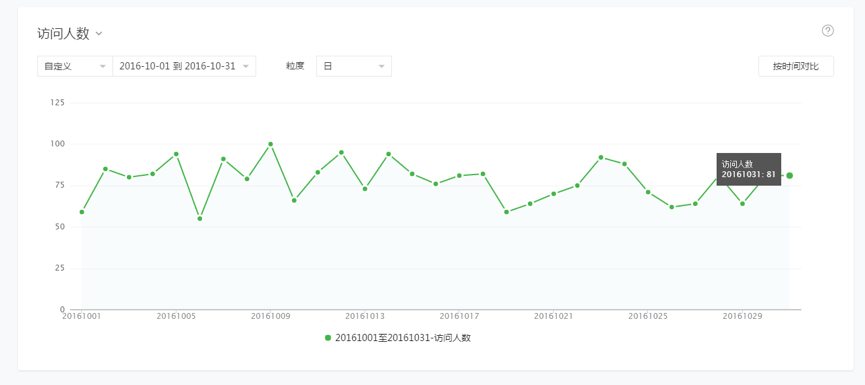
This feature allows you to view the Mini Program's user visit trends, including opens, visits, unique visitors, new users, average visit depth, and average duration by user and by opens. For more details, see [Glossary - KPI]).
You can select the time granularity and view by day, week, or month. When the granularity is week or month, the values are accumulated totals, except in the case of user numbers, which refer to unique users.
# Visit Distribution
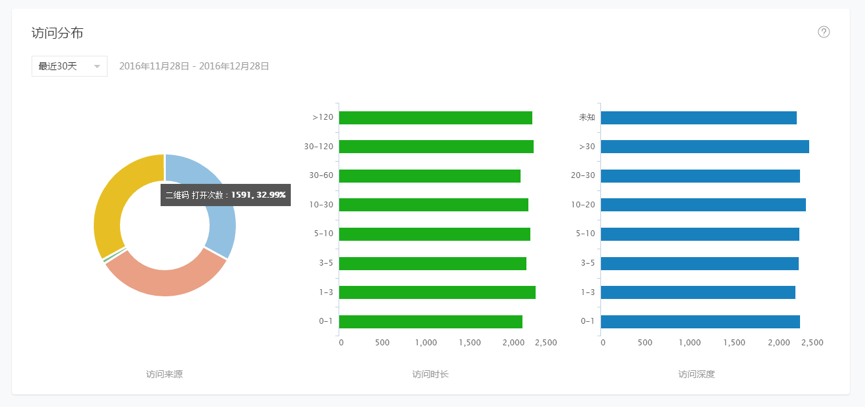
Visit source: The scenario by which the user visits the Mini Program. For example, from their Mini Program history or from a QR code. You can also check the number of times a Mini Program is opened in each scenario to analyze channels via which the user opens the Mini Program.
Visit duration: Refers to the time length of a user's stay in the Mini Program, which begins when they open it and ends when they close it or exit it due to timeout. You can view the number of opens for each duration grouping to analyze users' level of interest or reliance.
Visit depth: Refers to the number of unique screens that the user visits from when the user opens the Mini Program to when the user closes it or exits it due to timeout. You can view the number of opens for each depth grouping to better understand the distribution of ordinary users and heavy users.
# Visit Retention
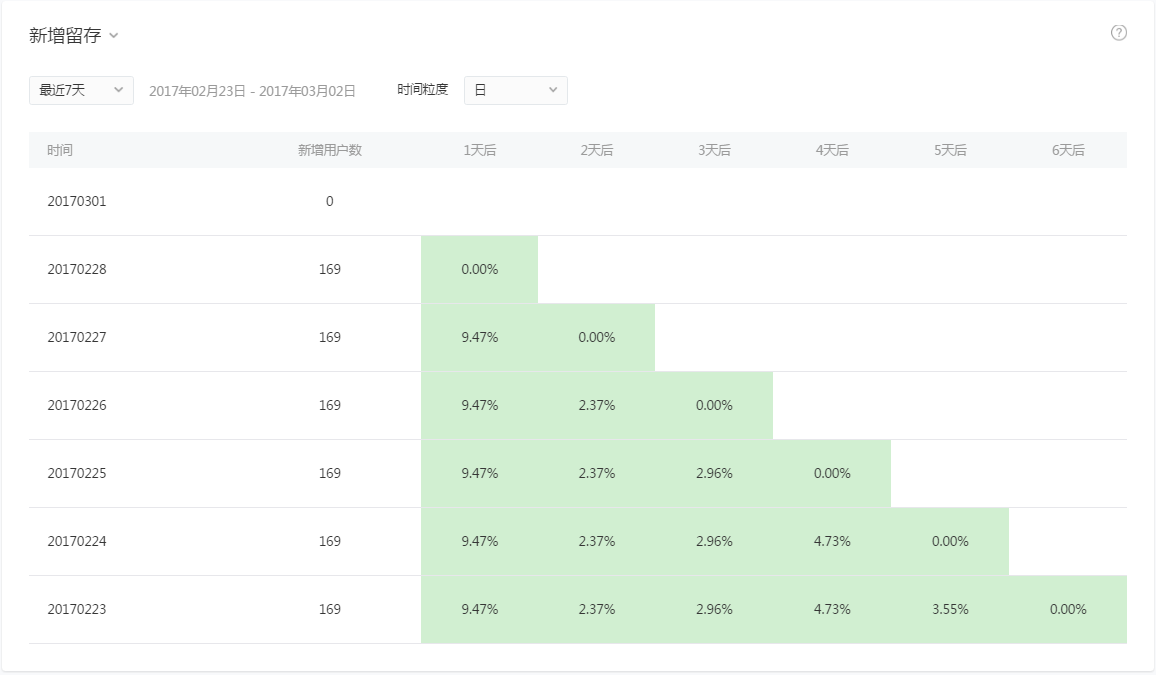
You can select the time granularity and view user visit retention by day, week, or month. When the granularity is week or month, the values are accumulated, except in the case of user numbers, which refer to unique users.
New user retention: Calculate the percentage of new users who revisit the Mini Program N days (or weeks or months) after first visiting the Mini Program. For example, if there were 100 users who visited the Mini Program for the first time on January 1st, and by January 3rd, 10 of them are still visiting the Mini Program, then the 2-day retention rate is 10.0%.
Active user retention: Calculate the percentage of active users who revisit the Mini Program N days (or weeks or months) after actively visiting the Mini Program. For example, if there were 1000 users who visited the Mini Program on January 1st, and by January 3rd, 300 of them are still visiting the Mini Program, then the 2-day retention rate is 30.0%.
# Visited Screen
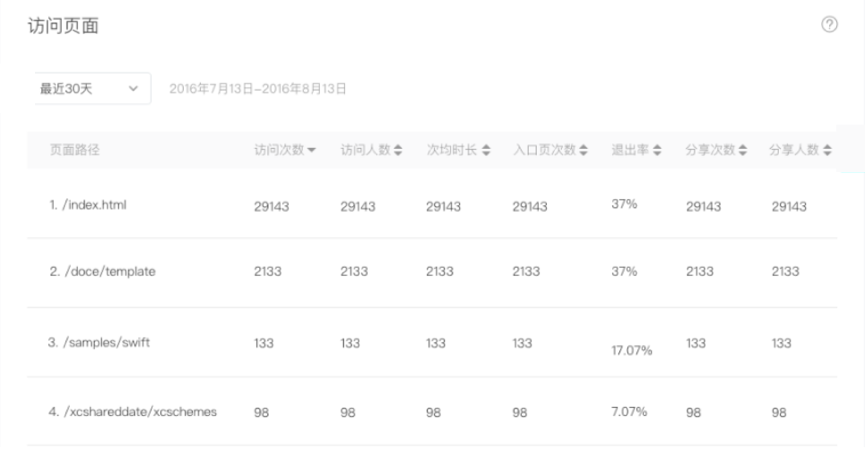
This feature allows you to check the visits, unique users, usage duration per visit, landing and exit screen visits, exit rate, shares, and sharing users of a Mini Program's screen. For more details, see [Glossary - KPI]).
The above KPIs are the accumulated values within a time period. You can sort them so that they appear by single KPI.
# User Portrait
This feature allows you to view new and active user portrait distribution over a set time period. It supports the viewing of data from the past 1, 7, or 30 days. New users is the number of unique users who visited the Mini Program for the first time within the set time period, while active users is the number of unique users who visited the Mini Program within the set time period. Detailed data can be downloaded for further analysis.
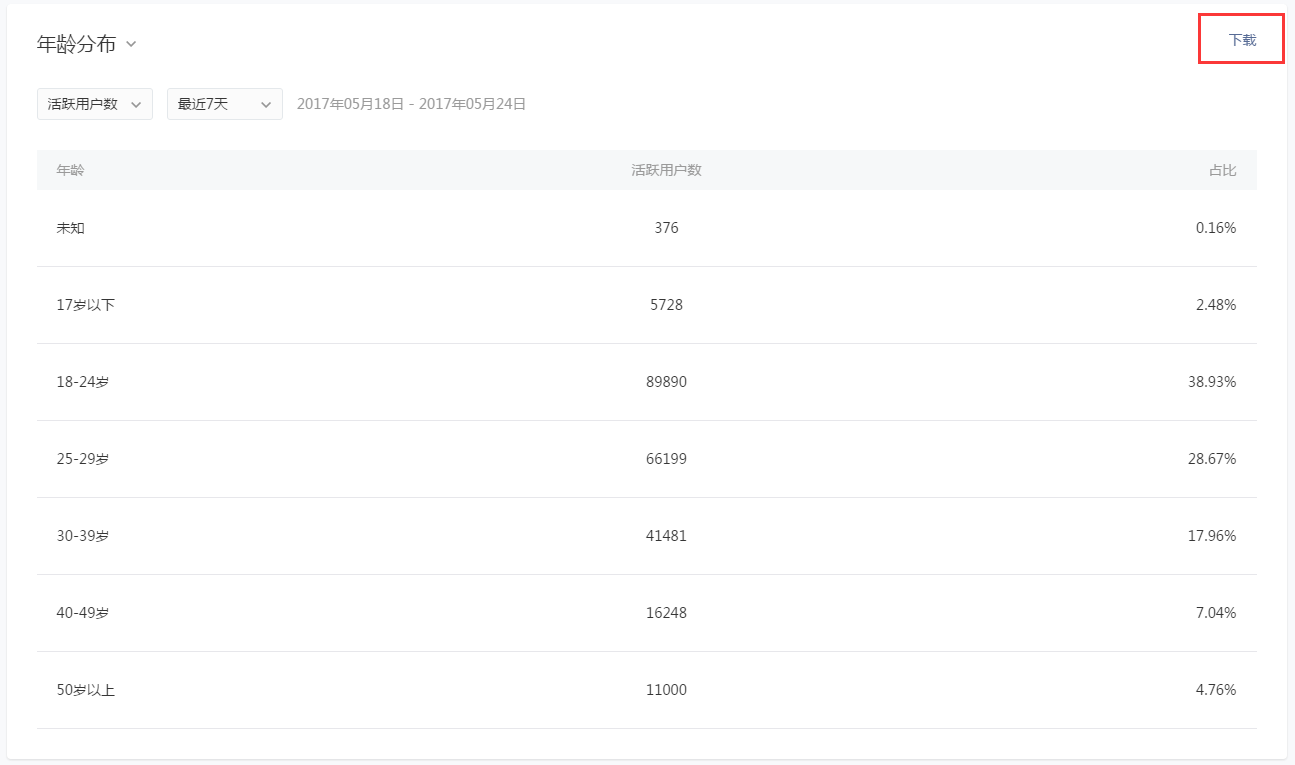
# Gender and Age Distribution
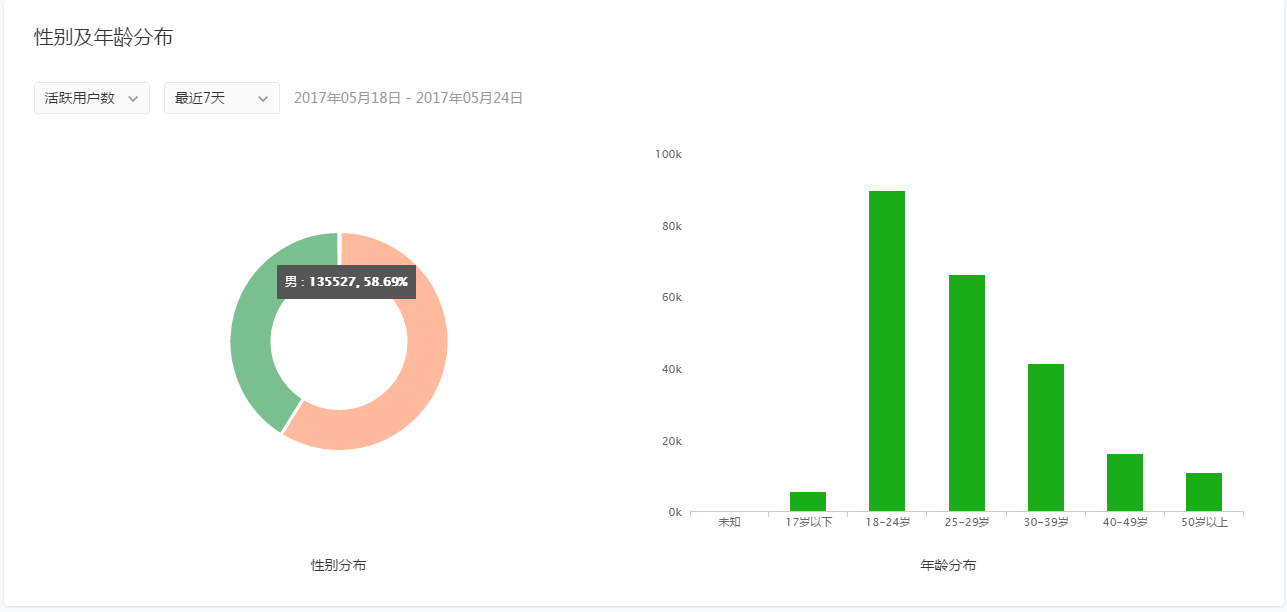 This feature allows you to view the gender and age distribution of new and active users. If user property data is incomplete, it may display as "Unknown".
# Region Distribution
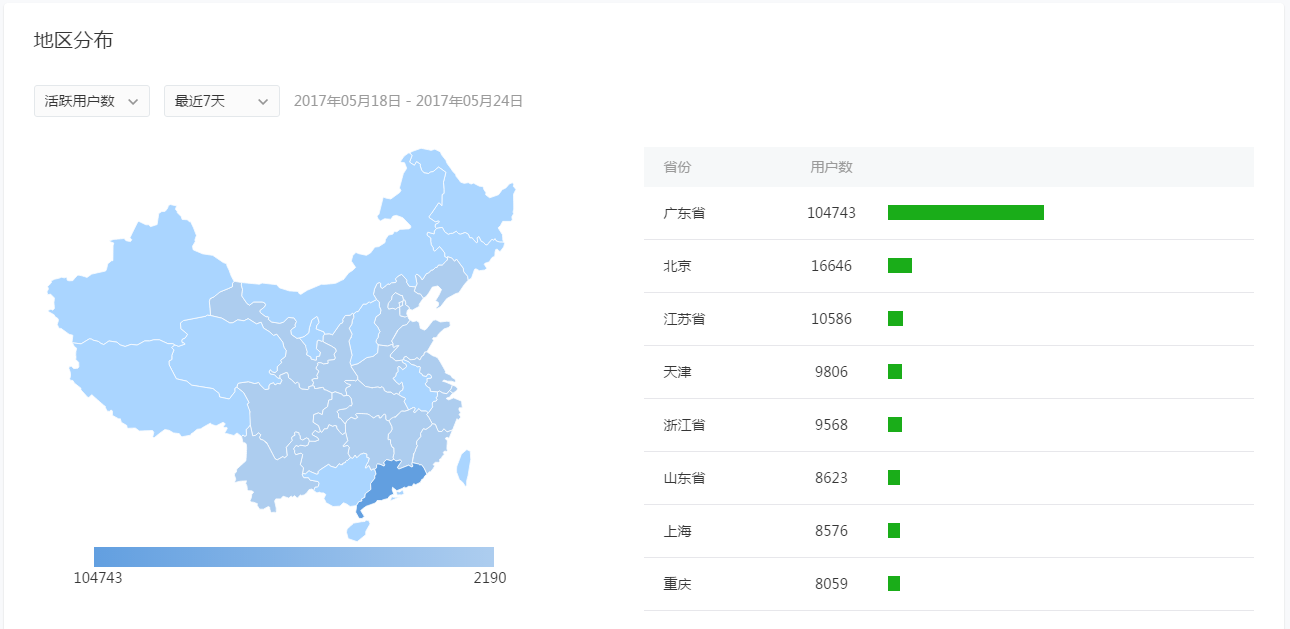
This feature allows you to view the main provinces that new and active users come from. The diagram only displays the top 10 provinces that most users are from. The complete data can be viewed at the bottom of the page or downloaded for further analysis. If user property data is incomplete, it may display as "Unknown".
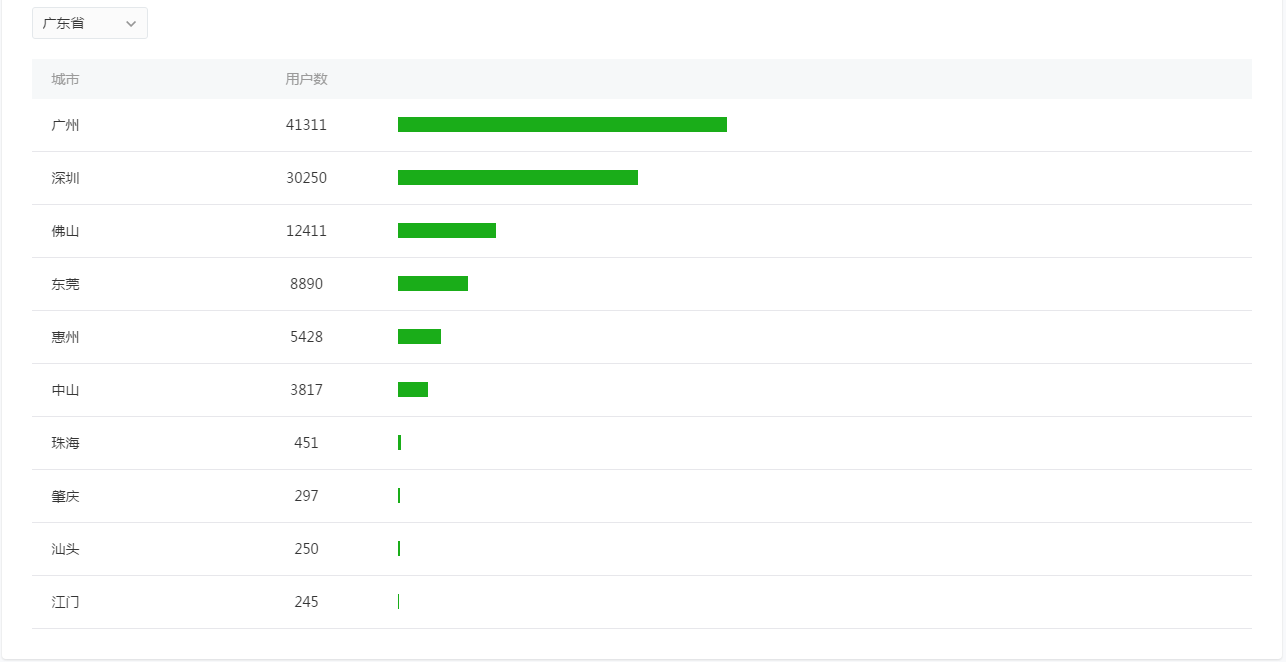 You can also view the main cities that new and active users come from. You can select to display city data for the country or for individual provinces. The complete data can be viewed at the bottom of the page or downloaded for further analysis. If user property data is incomplete, it may display as "Unknown".
# Mobile Platform and Device Model Distribution
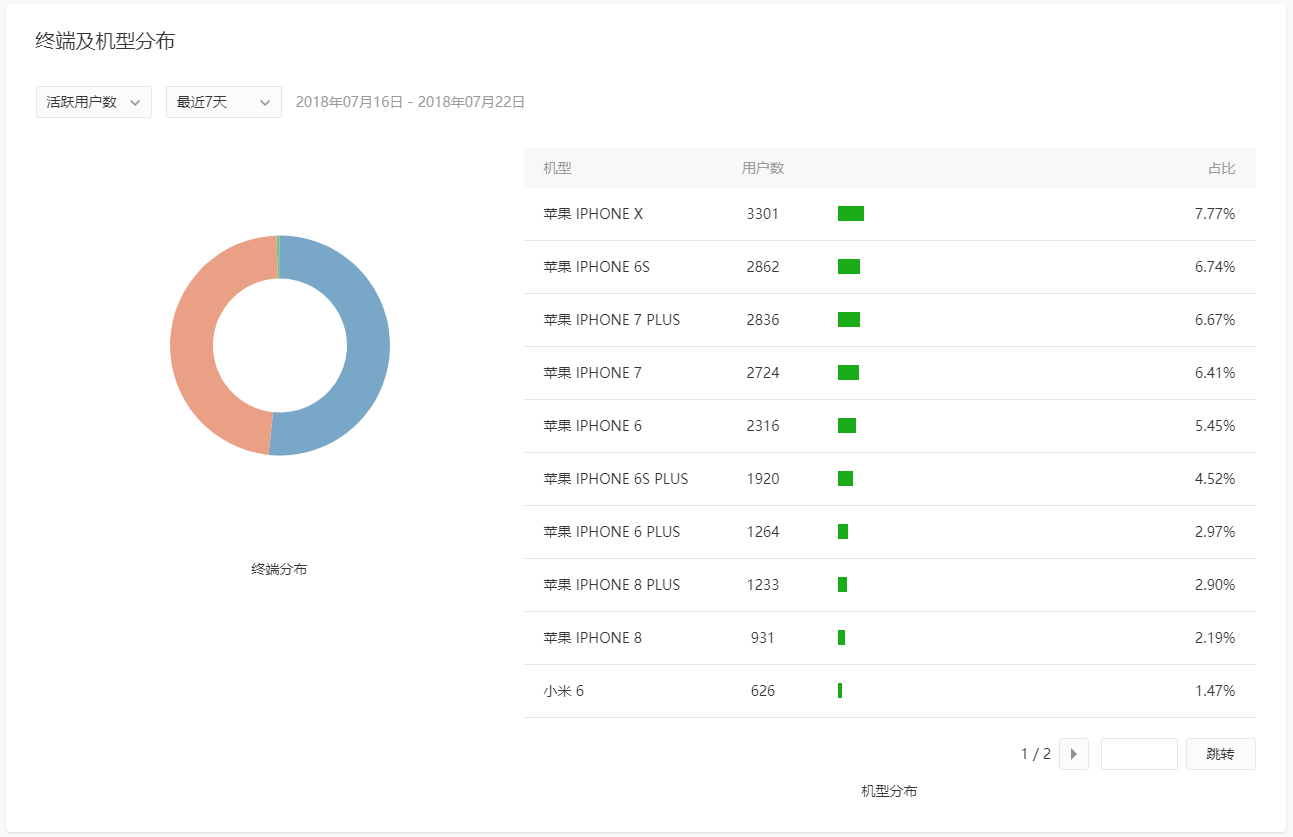
This feature allows you to view the mobile platform and device models used by new and active users. Mobile platforms include iPhone, Android, and other devices. Only the top 20 device models most used by users are currently provided. If user device model data is incomplete, it may display as "Unknown".
Of the detailed user data outlined above, the data for age, gender, province, city, mobile platform, and device model can all be downloaded for further analysis.