# Mini Program speed measurement
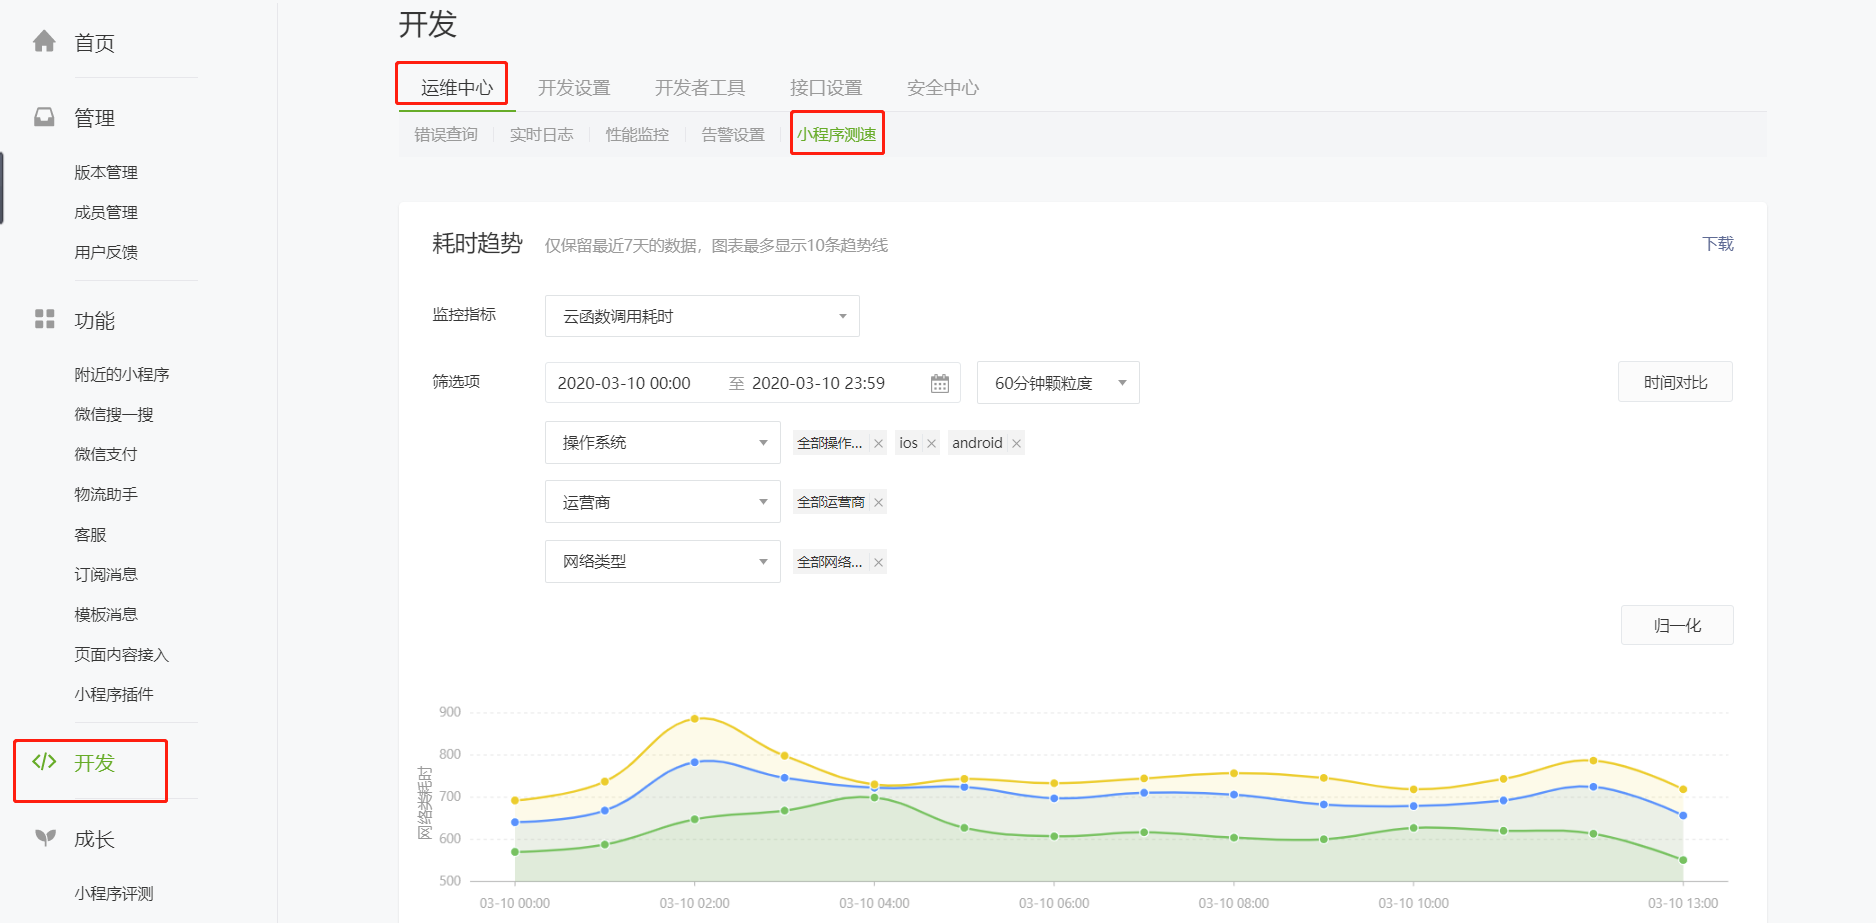
To help developers optimize Mini Program performance, we introduced the "Mini Program Speed" feature. "Mini Program Speed Measurement" can simply and conveniently count the real-time time consuming of an event within the Mini Program, and can be cross-analyzed according to the region, operator, operating system, network type, model and other key dimensions. From the base 2.9.2 start, developers through the "speed report" interface reported a indicator of the time-consuming situation, can be in the Mini Program management background " Development - Operations Center - Mini Programs Speed Measurement " View time trends of indicators, and support real-time view of minute-level data.
# New Build Monitoring ID
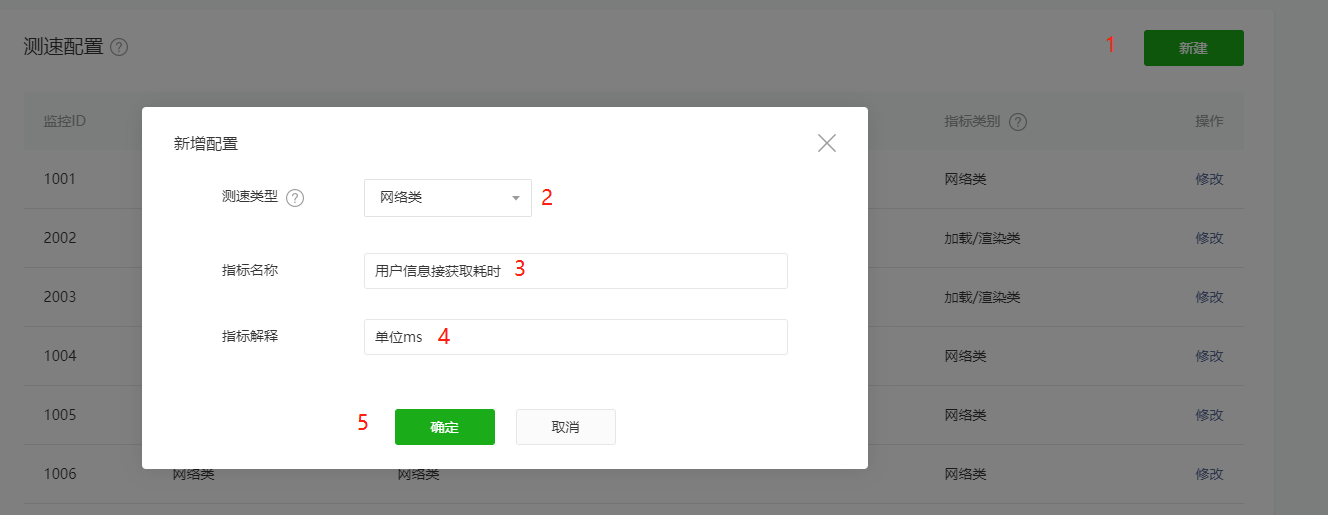
In order to achieve time-consuming monitoring of an indicator, developers need to define monitoring indicators. In Mini Program admin background (mp.weixin.qq.com). : " Development - Operations Center - Mini Programs Speed Measurement " New Monitor in ID, and fill in the name and explanation of the monitoring indicator.
Click "New" to create a new ID , you need to select the indicator type and fill in the indicator name and the indicator corresponding explanation. Monitoring indicators fall into two categories:
NetRequest Class: This kind of time is mainly affected by the network environment, including operating system, operators, network environment and other statistical dimensions. Such as: network api Time consuming, cloud calls time consuming and network data read and write time consuming etc. Note that up to 20 such indicators can be created.
to load/Rendering classThis kind of time is mainly affected by device performance, including operating system, type and other statistical dimensions. Can be used to measure page switching time, component rendering time, etc. Note that up to 20 such indicators can be created.
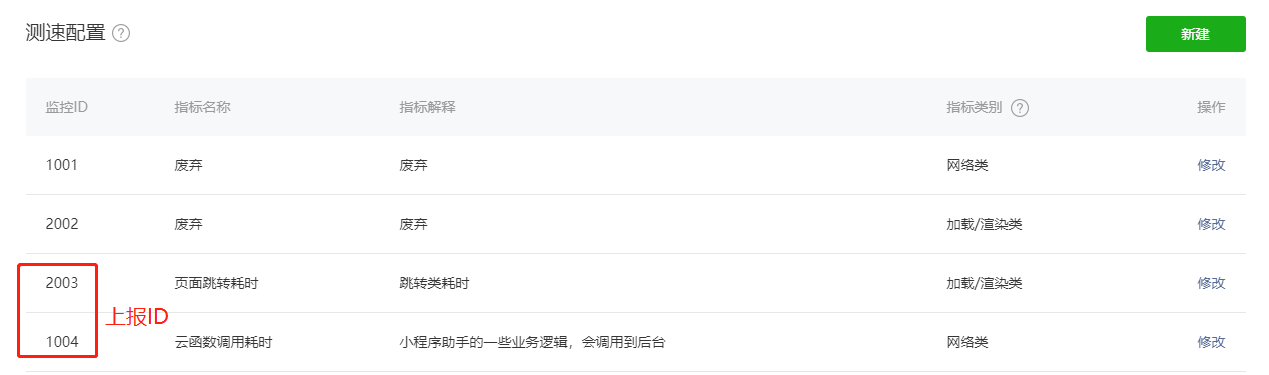
After new, you can see the monitoring that needs to be used ID 。
# Speed reporting
After the developer defines the monitoring ID, it needs to be called in the Mini Program code wx.reportPerformance Interface to report the value of time to achieve time monitoring:
Method 1: use canIUse To make judgments
// * Need to use canIUse Determine whether the interface is available
if (wx.canIUse('reportPerformance')) {
  wx.reportPerformance(id, val)
}
Method 2: Use compareVersion To make judgments
// * Need to use first compareVersion Determine whether the interface is available
const sdkVersion = wx.getSystemInfoSync().SDKVersion
if (compareVersion(sdkVersion, '2.9.2') >= 0) {
  wx.reportPerformance(id, val)
}
id and val Both uint32 Type, which id Manage background defined monitoring for Mini Programs ID,val For this time to report the value of time (calculated by the developer). Interface calls require the version number of the underlying library to be higher than 2.9.2, otherwise it may be misreported in some lower version base libraries.
(compareVersion [definition]](https://developers.weixin.qq.com/miniprogram/dev/framework/compatibility.html))
# Data Watch
After completing the code reporting, can be in the Mini Program management background " Development - Operations Center - Mini Programs Speed Measurement " View time consuming trends for each indicator. Currently online data has a delay of about 15 minutes, reported data retention 7 Days, may be ordered in accordance with the 1 minute - 1 Hours and other different time granularity are aggregated.
Two curves can be observed for each index, namely the average curve and the reported times curve.

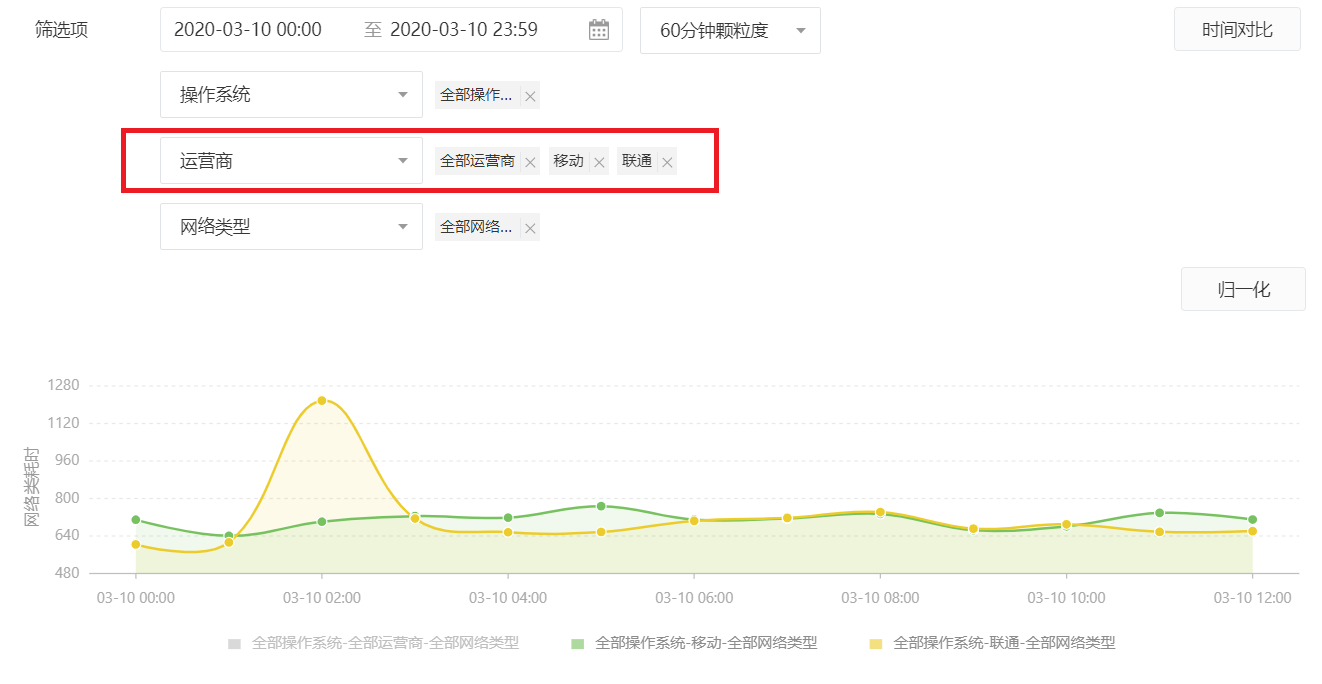
At the same time for different dimensions of data, we provide a cross-comparison function to help you complete the analysis quickly and easily, pay attention to the cross-comparison curve number can not exceed 10.
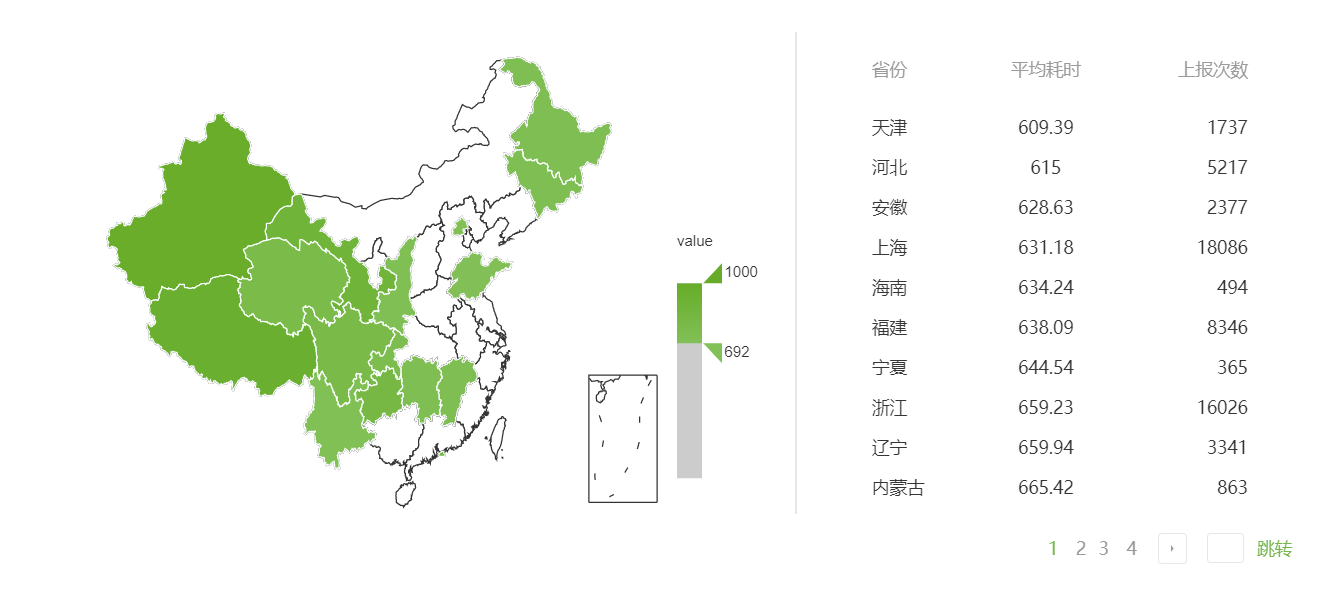
For network request indicators, we provide a regional map to help you quickly locate regional resources.
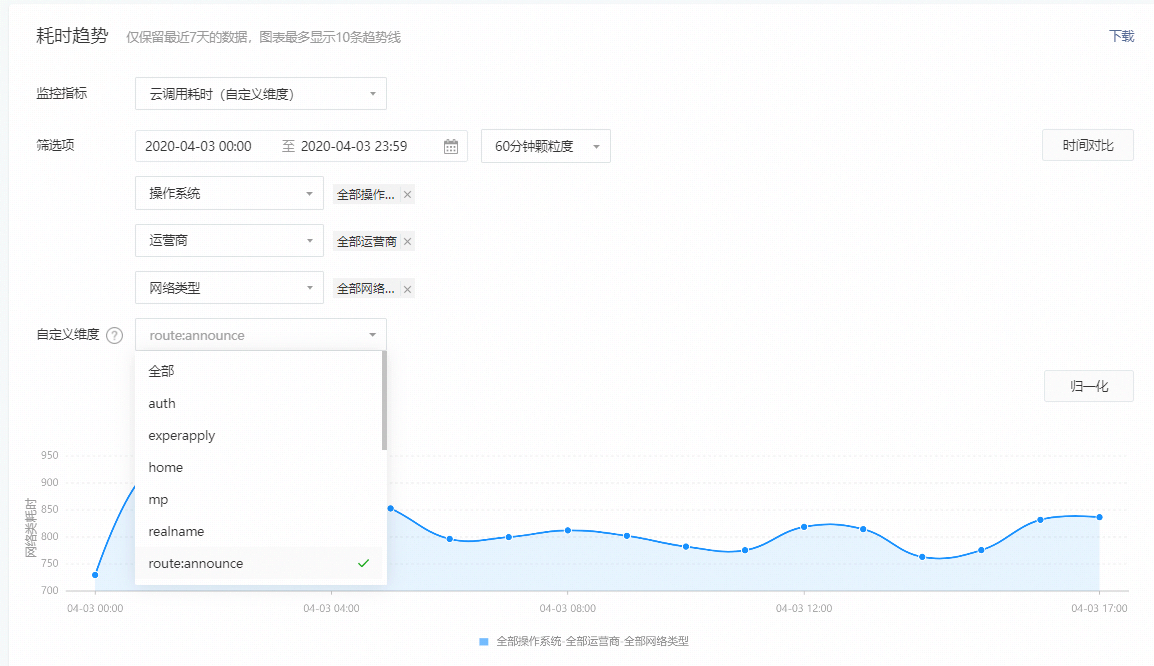
# Custom Dimensions(Optional Features)
For more complex user scenarios, users may need to segment speed data based on dimensions such as url, page, So we provide custom dimension, users can fill in some business dimension strings into custom dimension to facilitate business analysis. Currently, the number of custom latitude values per metric needs to be limited to 50 (over-limited data is discarded) and the length of custom dimension values to 256 bytes (over-restricted values are truncated). The use of custom dimensions has the following effects:
To use a custom dimension, just add a third parameter, dimension, to wx.reportPerformance to report the custom dimension:
wx.reportPerformance(id, value, dimensions)
(wx.reportPerformance Document)
# Q&A
Q : In what scenarios can a speed measurement system work?
A : Can measure network class metrics (such as network call/Cloud call time consuming, network data read and write speed, etc.) and non-network class metrics (page switching load speed, component rendering speed, and so on). You can see the quantitative distribution and performance differences of these metrics across different dimensions. It can also play a role in computing video first screen delay and frame rate.
Q What is the base library version required to report the API?
A : Base library version required 2.9.2 Above. Errors may be reported on some low version base libraries, will be supported later with canIUse Interface to make judgments.
Q: Is the system available in beta? What is the reported delay? How long is the data kept?
A : Can be used in the beta, the current reported delay is 15 Minutes or so. Data will be saved 7 Oh, God.
Q: How many metrics can I define ID?
A : Single Mini Program. Each category can define 20 individual ID。