# Overview
Remote debugging allows you to directly debug a Mini Program on the mobile phone via network connection using Weixin DevTools, making it easy for you to pinpoint errors on the phone.
# Debugging Process
To initiate a remote debugging process, you first need to click the Remote Debugging button on the toolbar of the Weixin DevTools.

Then the DevTools will process, package, and upload the local code. When it is ready, you can scan the QR code via the Weixin app to open the debugging window and start remote debugging.
# Remote Debugging Window
Scan the QR code with your mobile phone to start remote debugging.
To end debugging, directly close this debugging window or click the End Debugging button in the lower right corner.
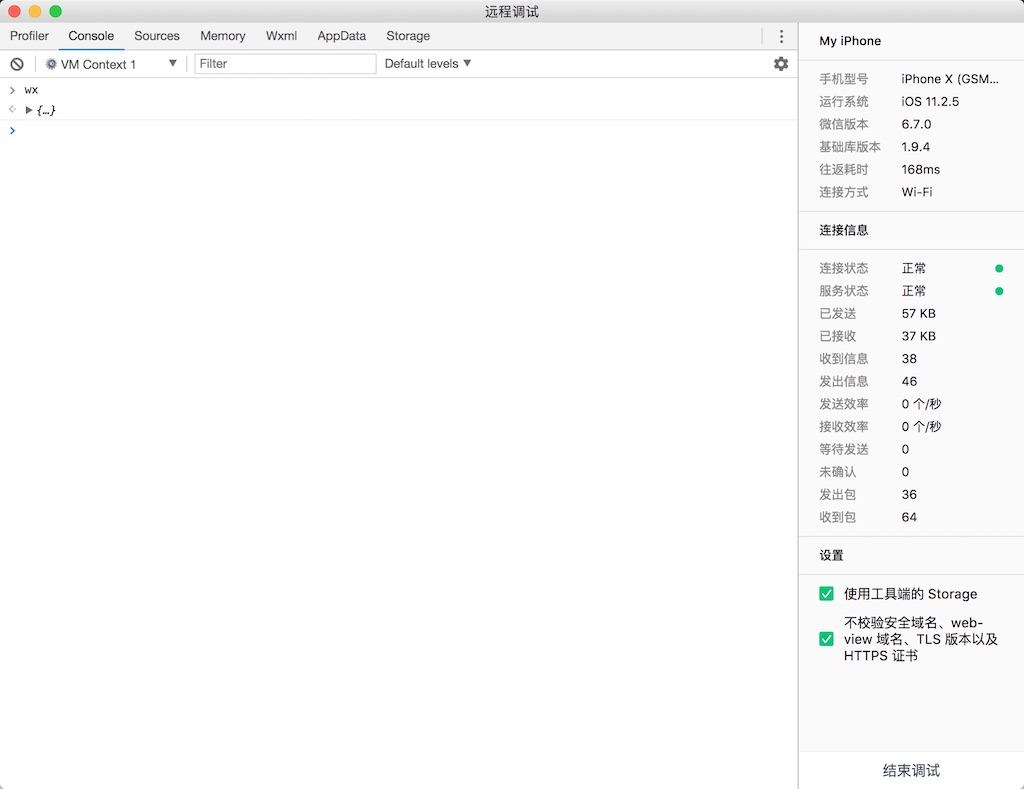
The remote debugging window has two sections: the debugger view on the left and the information view on the right. You can debug code directly and see Storage details in the debugger view, and check current connection with the phone and the server, as well as error messages in the information view.
# Debugger
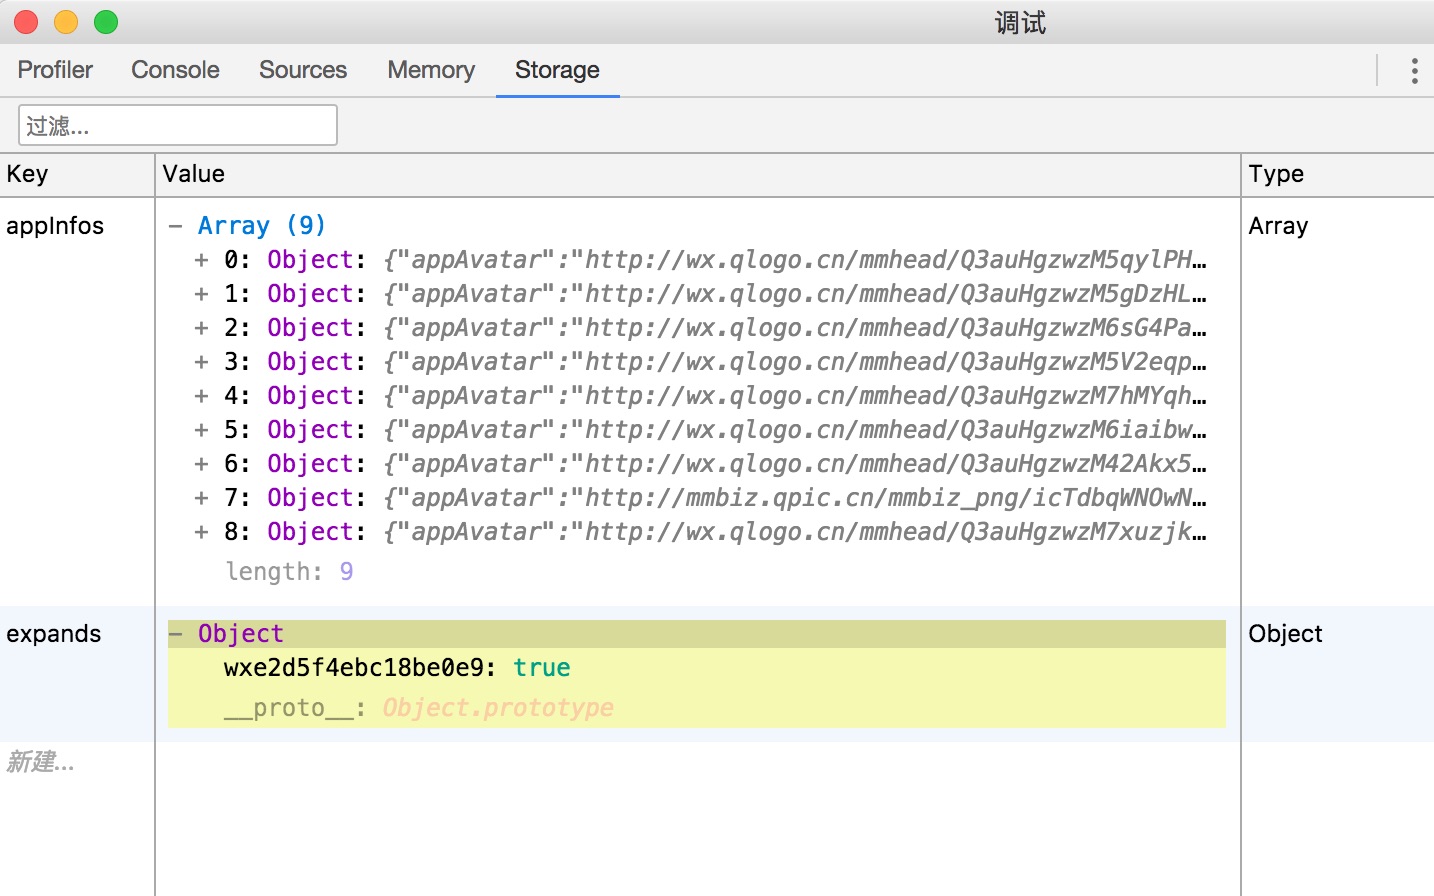
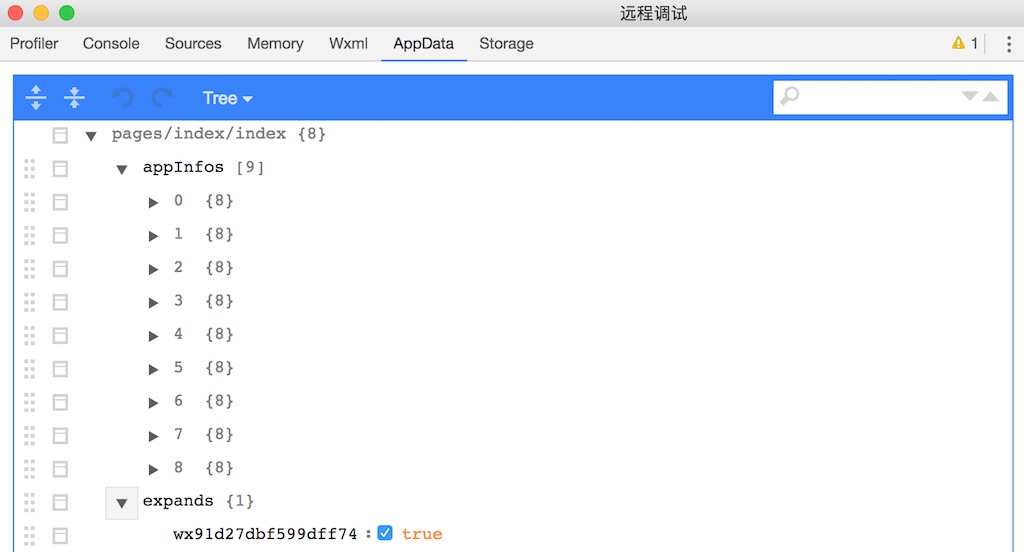
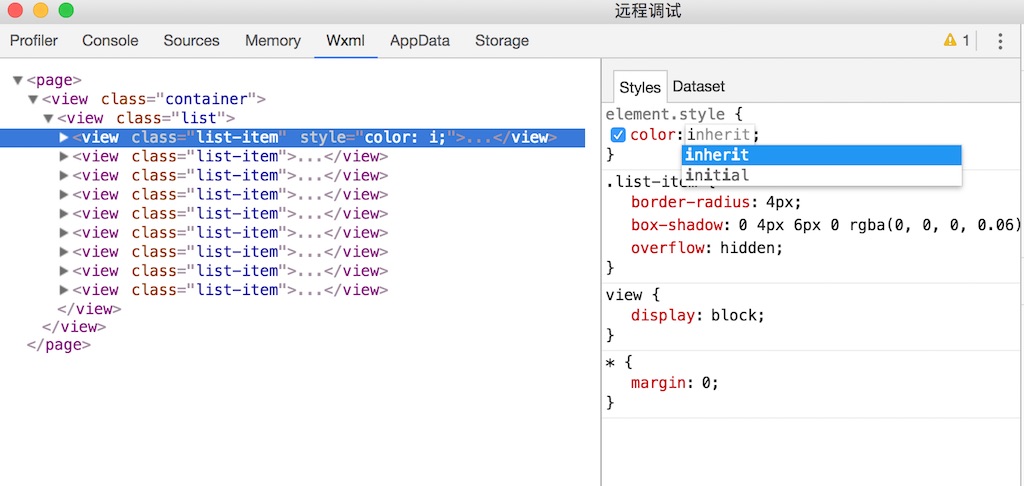
In the debugger for remote debugging, you can debug code in the Console panel, view the source code of a Mini Program and perform breakpoint or single-step debugging in the Sources panel, and view the Storage usage of a Mini Program in the Storage panel.
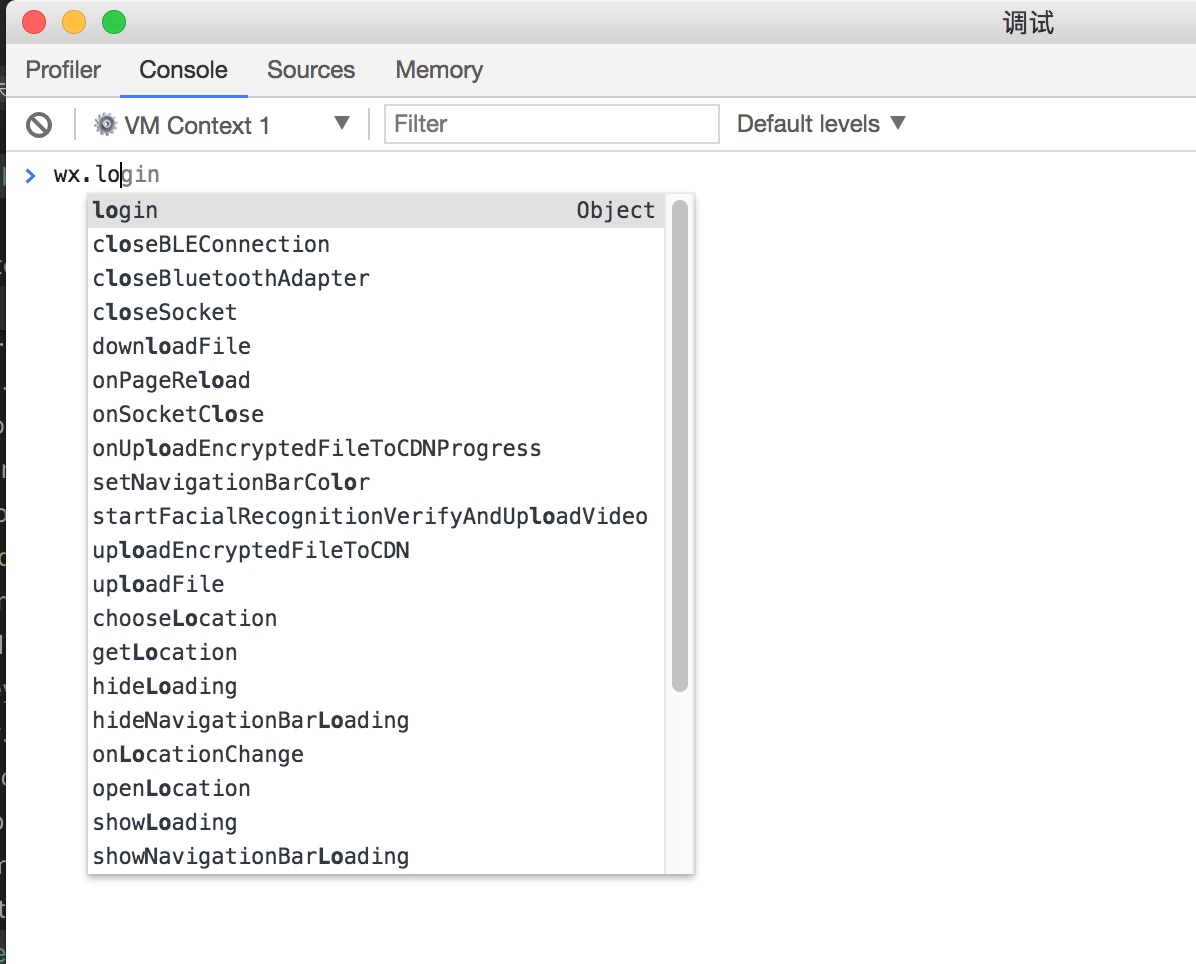
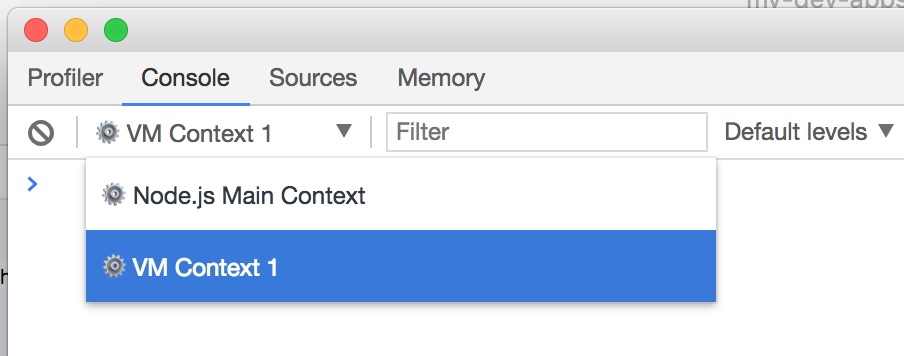
Note that you need to switch the context for debugging to VM Context 1 before debugging a Mini Program in the Console panel, as shown below.
When you view the source code in the Sources panel, all the file paths of developers begin with weapp://.
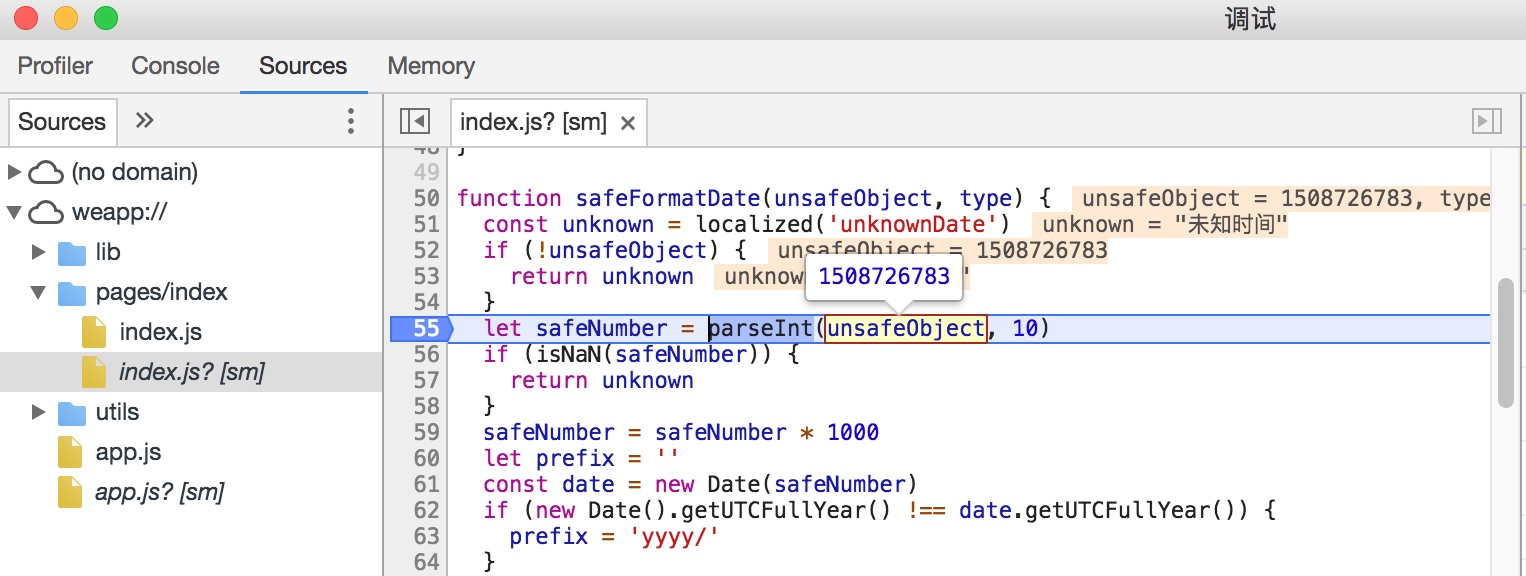
In addition to performing single-step debugging in the debugger, you can also perform breakpoint debugging by manually inserting the debugger; statement into the code. Therefore, if you want to start breakpoint debugging immediately after a Mini Program starts, you can manually insert the debugger; statement in the code at the required breakpoint before starting remote debugging.
The operations on the WXML, AppData, and Storage panels are the same as those in the debugger/simulator on Weixin DevTools. Note that if Use DevTools Storage is unchecked in the information view, all Storage data will be stored on the mobile phone and the Storage panel is no longer displayed.
# Information View
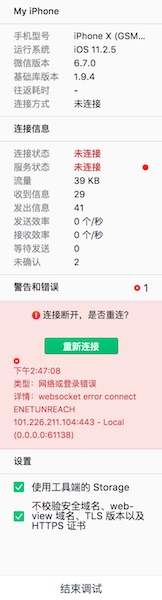
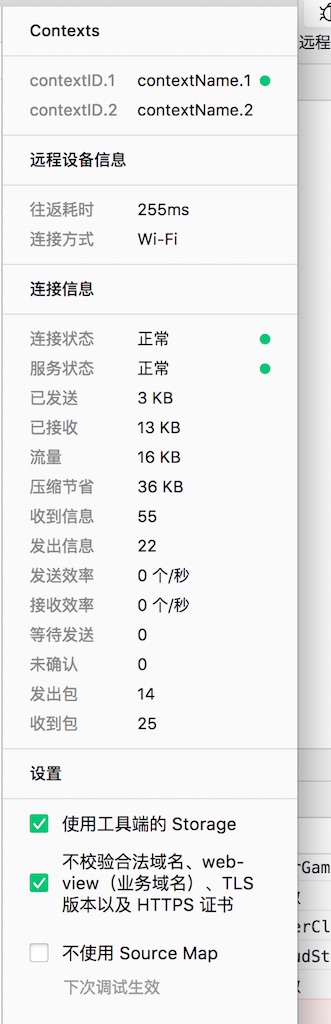
The information view on the right displays information about your mobile phone and network connection. The mobile information contains model, operating system, name, Weixin version, and communication latency. A smaller latency means smoother communication with the mobile phone.
Connection Information displays the connection information between the DevTools and the server, including connection status and server status. The status is shown here when the debugging process is affected due to connection failure or blocked server. When the connection status is Ended, the debugging has been terminated.
Warnings and Errors displays recent errors and warnings. In case of network disconnection, you will be asked whether to reconnect.
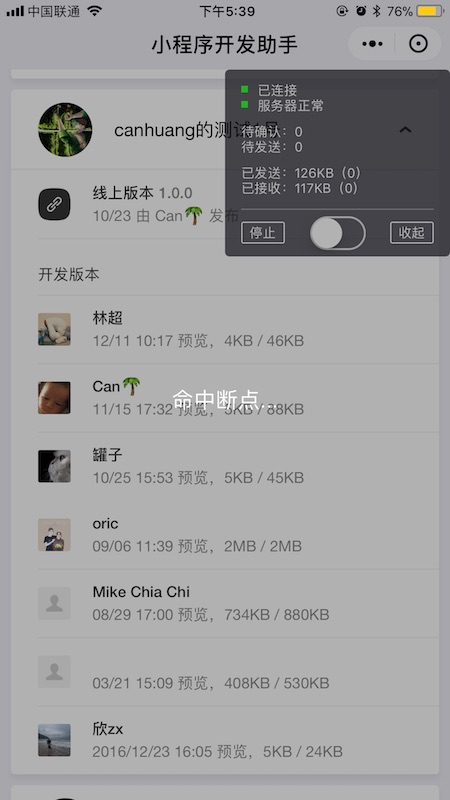
# Display on Mobile Phone
The debugging process is displayed on mobile phone as follows.
When there is no network connection or a breakpoint is hit, a flyout will appear to prevent further operations.
# Mini Games Remote Debugging
Supported as of DevTools 1.02.1809260, Weixin 6.7.2 for iOS 11.2-11.4.1, and Weixin 6.7.3 for Android.
Unlike Mini Programs, when debugging Mini Games, the Contexts column may appear on the right side of the debugging window, and you can click on a JavaScript context you want to debug.
By default, the DevTools will upload a Source Map with a complete source code for debugging purposes. If you do not want to upload the code, or if there is any error in the mapping of the lines and columns, you can disable the option in the lower right, and uncheck Auto compress and obfuscate code at upload in the project details.
Note: The Storage panel is not supported.