# Heat maps
The heat graph function quantifies the user's interaction behavior in the application in a visual way. The heat graph can provide a very intuitive insight into the user' interaction characteristics, along with the following features:
- Multiple types of heat graphs: Support to view click heat graphs and scroll heat graphs
- Population Screening: Supports viewing and comparing heat maps of different populations
- Weixin Mini Program Mimicry: can be directly in the control console visual operation Mini Program, point to any page can view the corresponding thermal map at any time
# Click on the heat diagram
By clicking the heat diagram, you can gain insight into the location of the user's high-frequency clicks, and you can discover both the user''s interest points, opportunity points, and unexpected clicks, thereby bringing opportunities for product optimization.
Control console will present an operable Weixin Mini Program, you can freely operate Mini programs, page jump and other operations, thermal map will be based on the current page state real-time rendering:
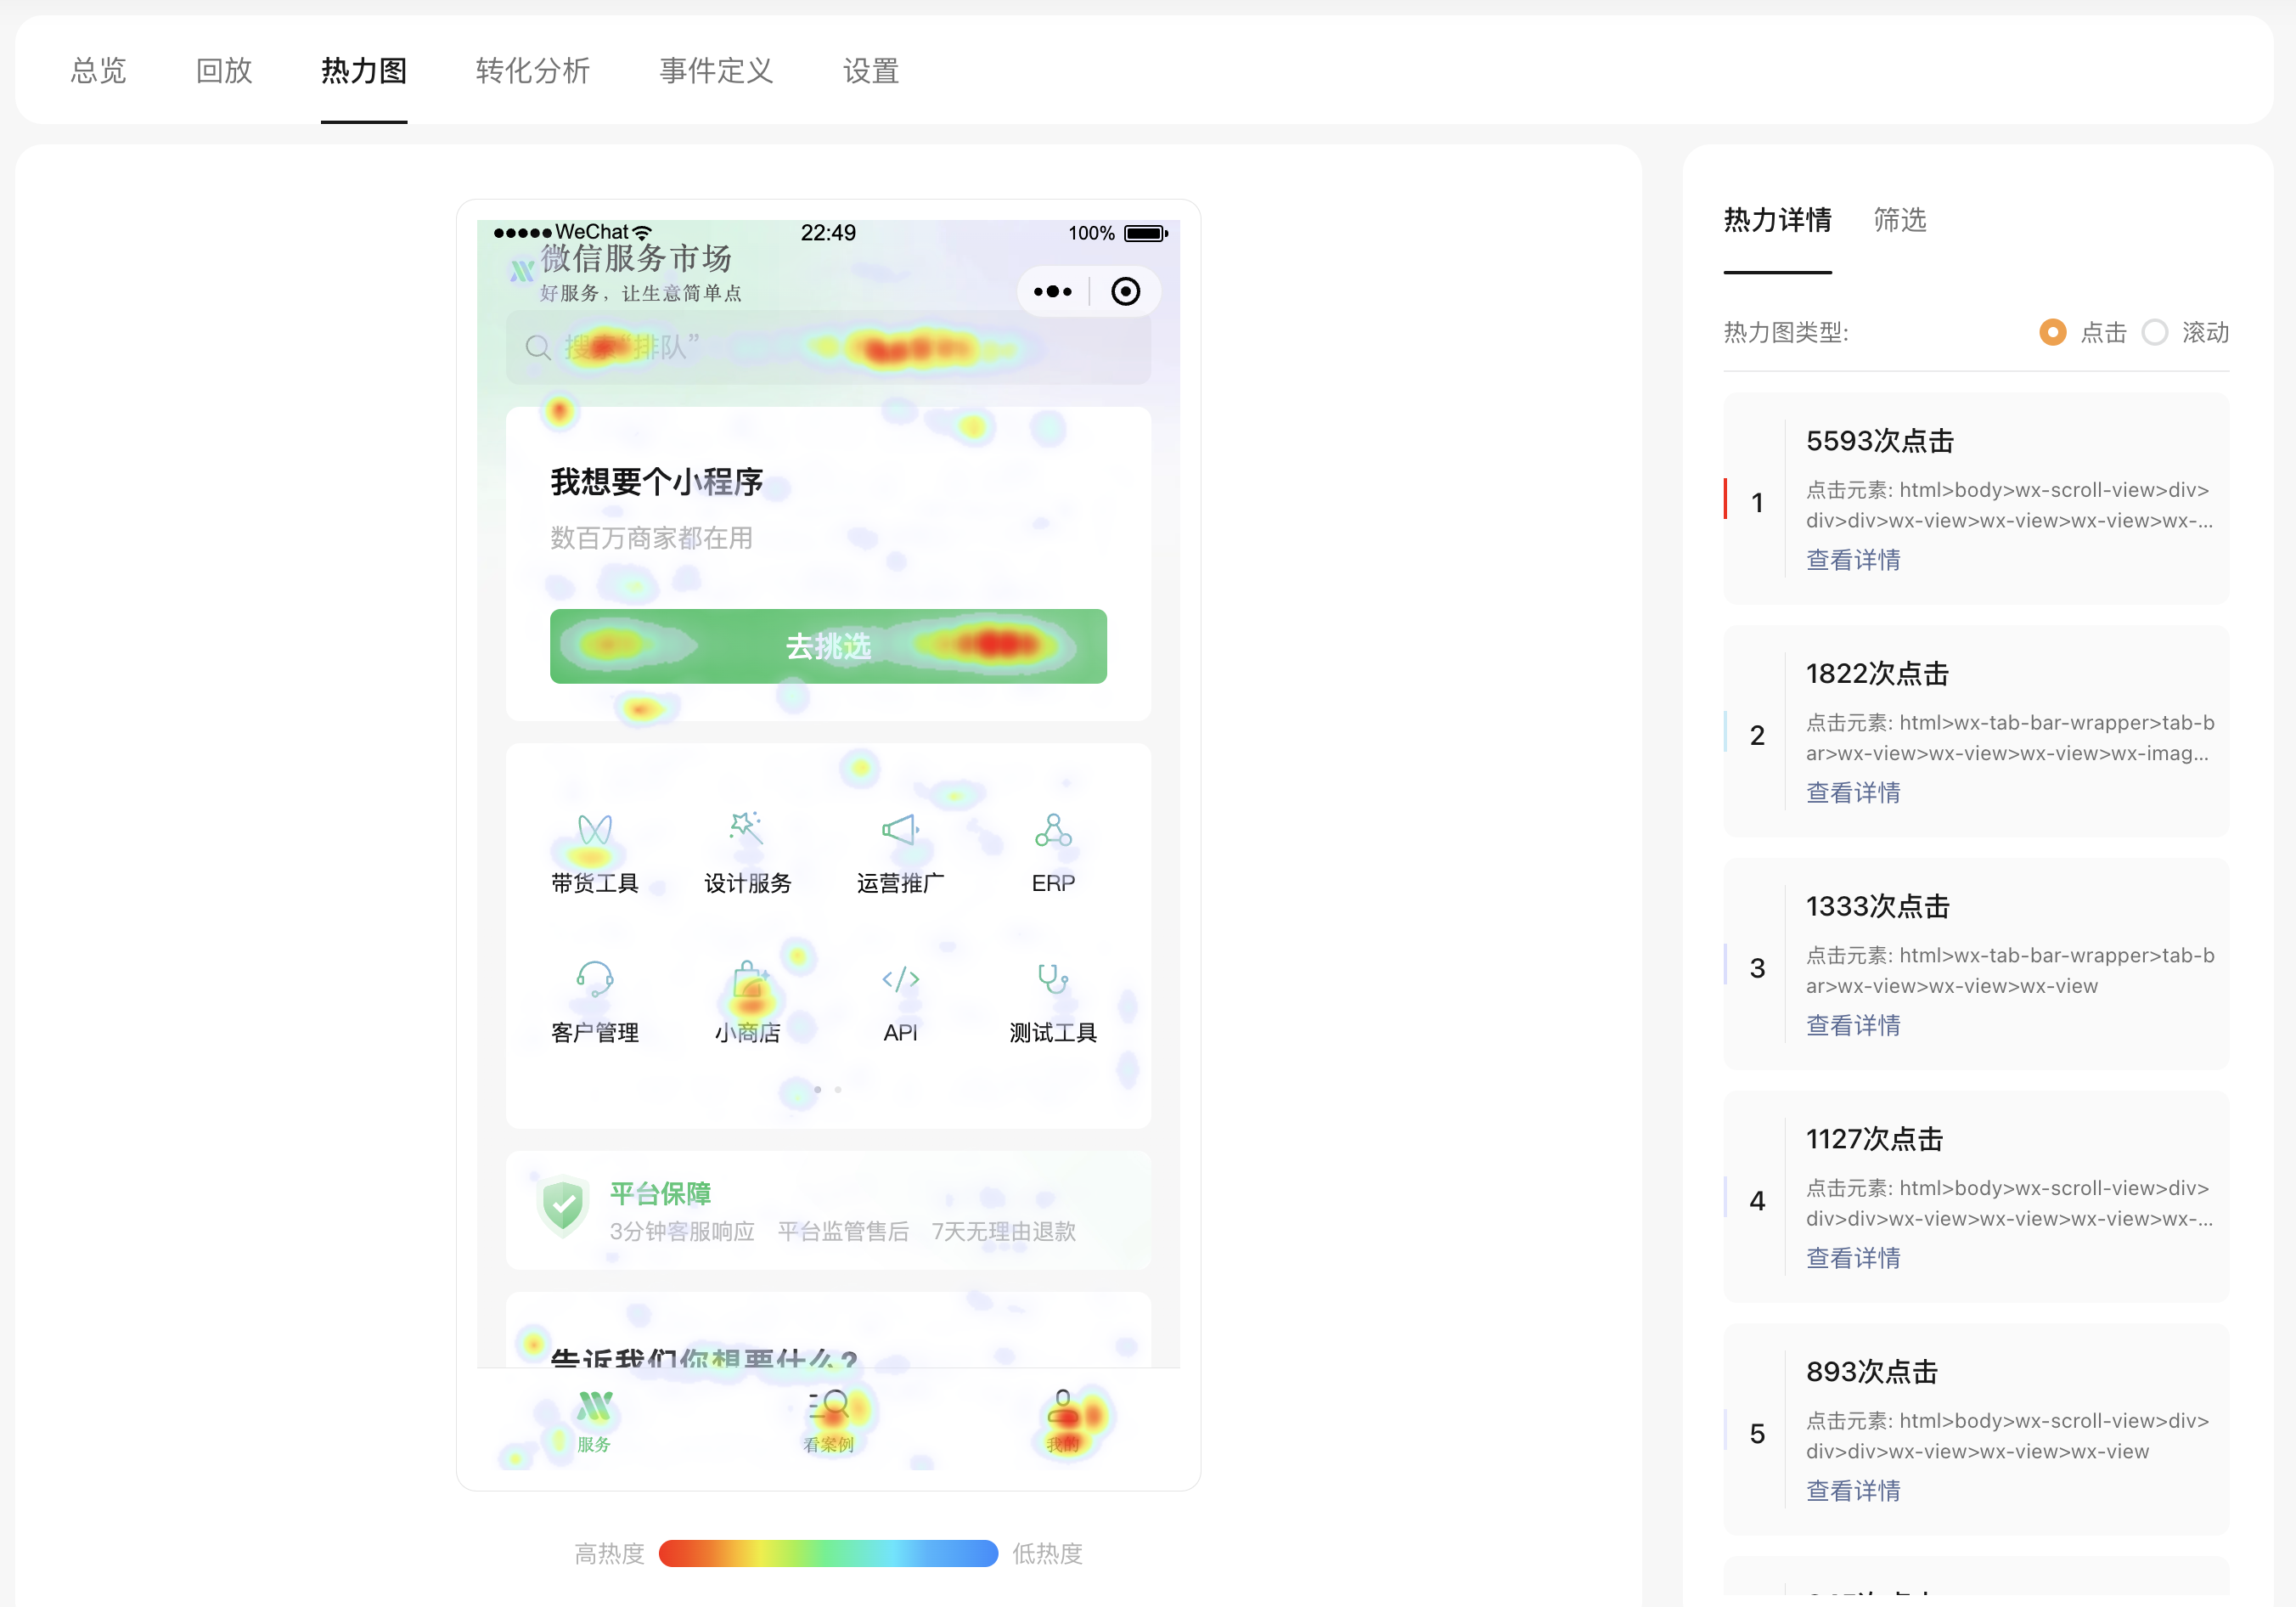
The heat diagram shows clicks on the current page by color, with the red element indicating the higher the number of clicks / exposure of that element. You can view specific element information in the event list on the right
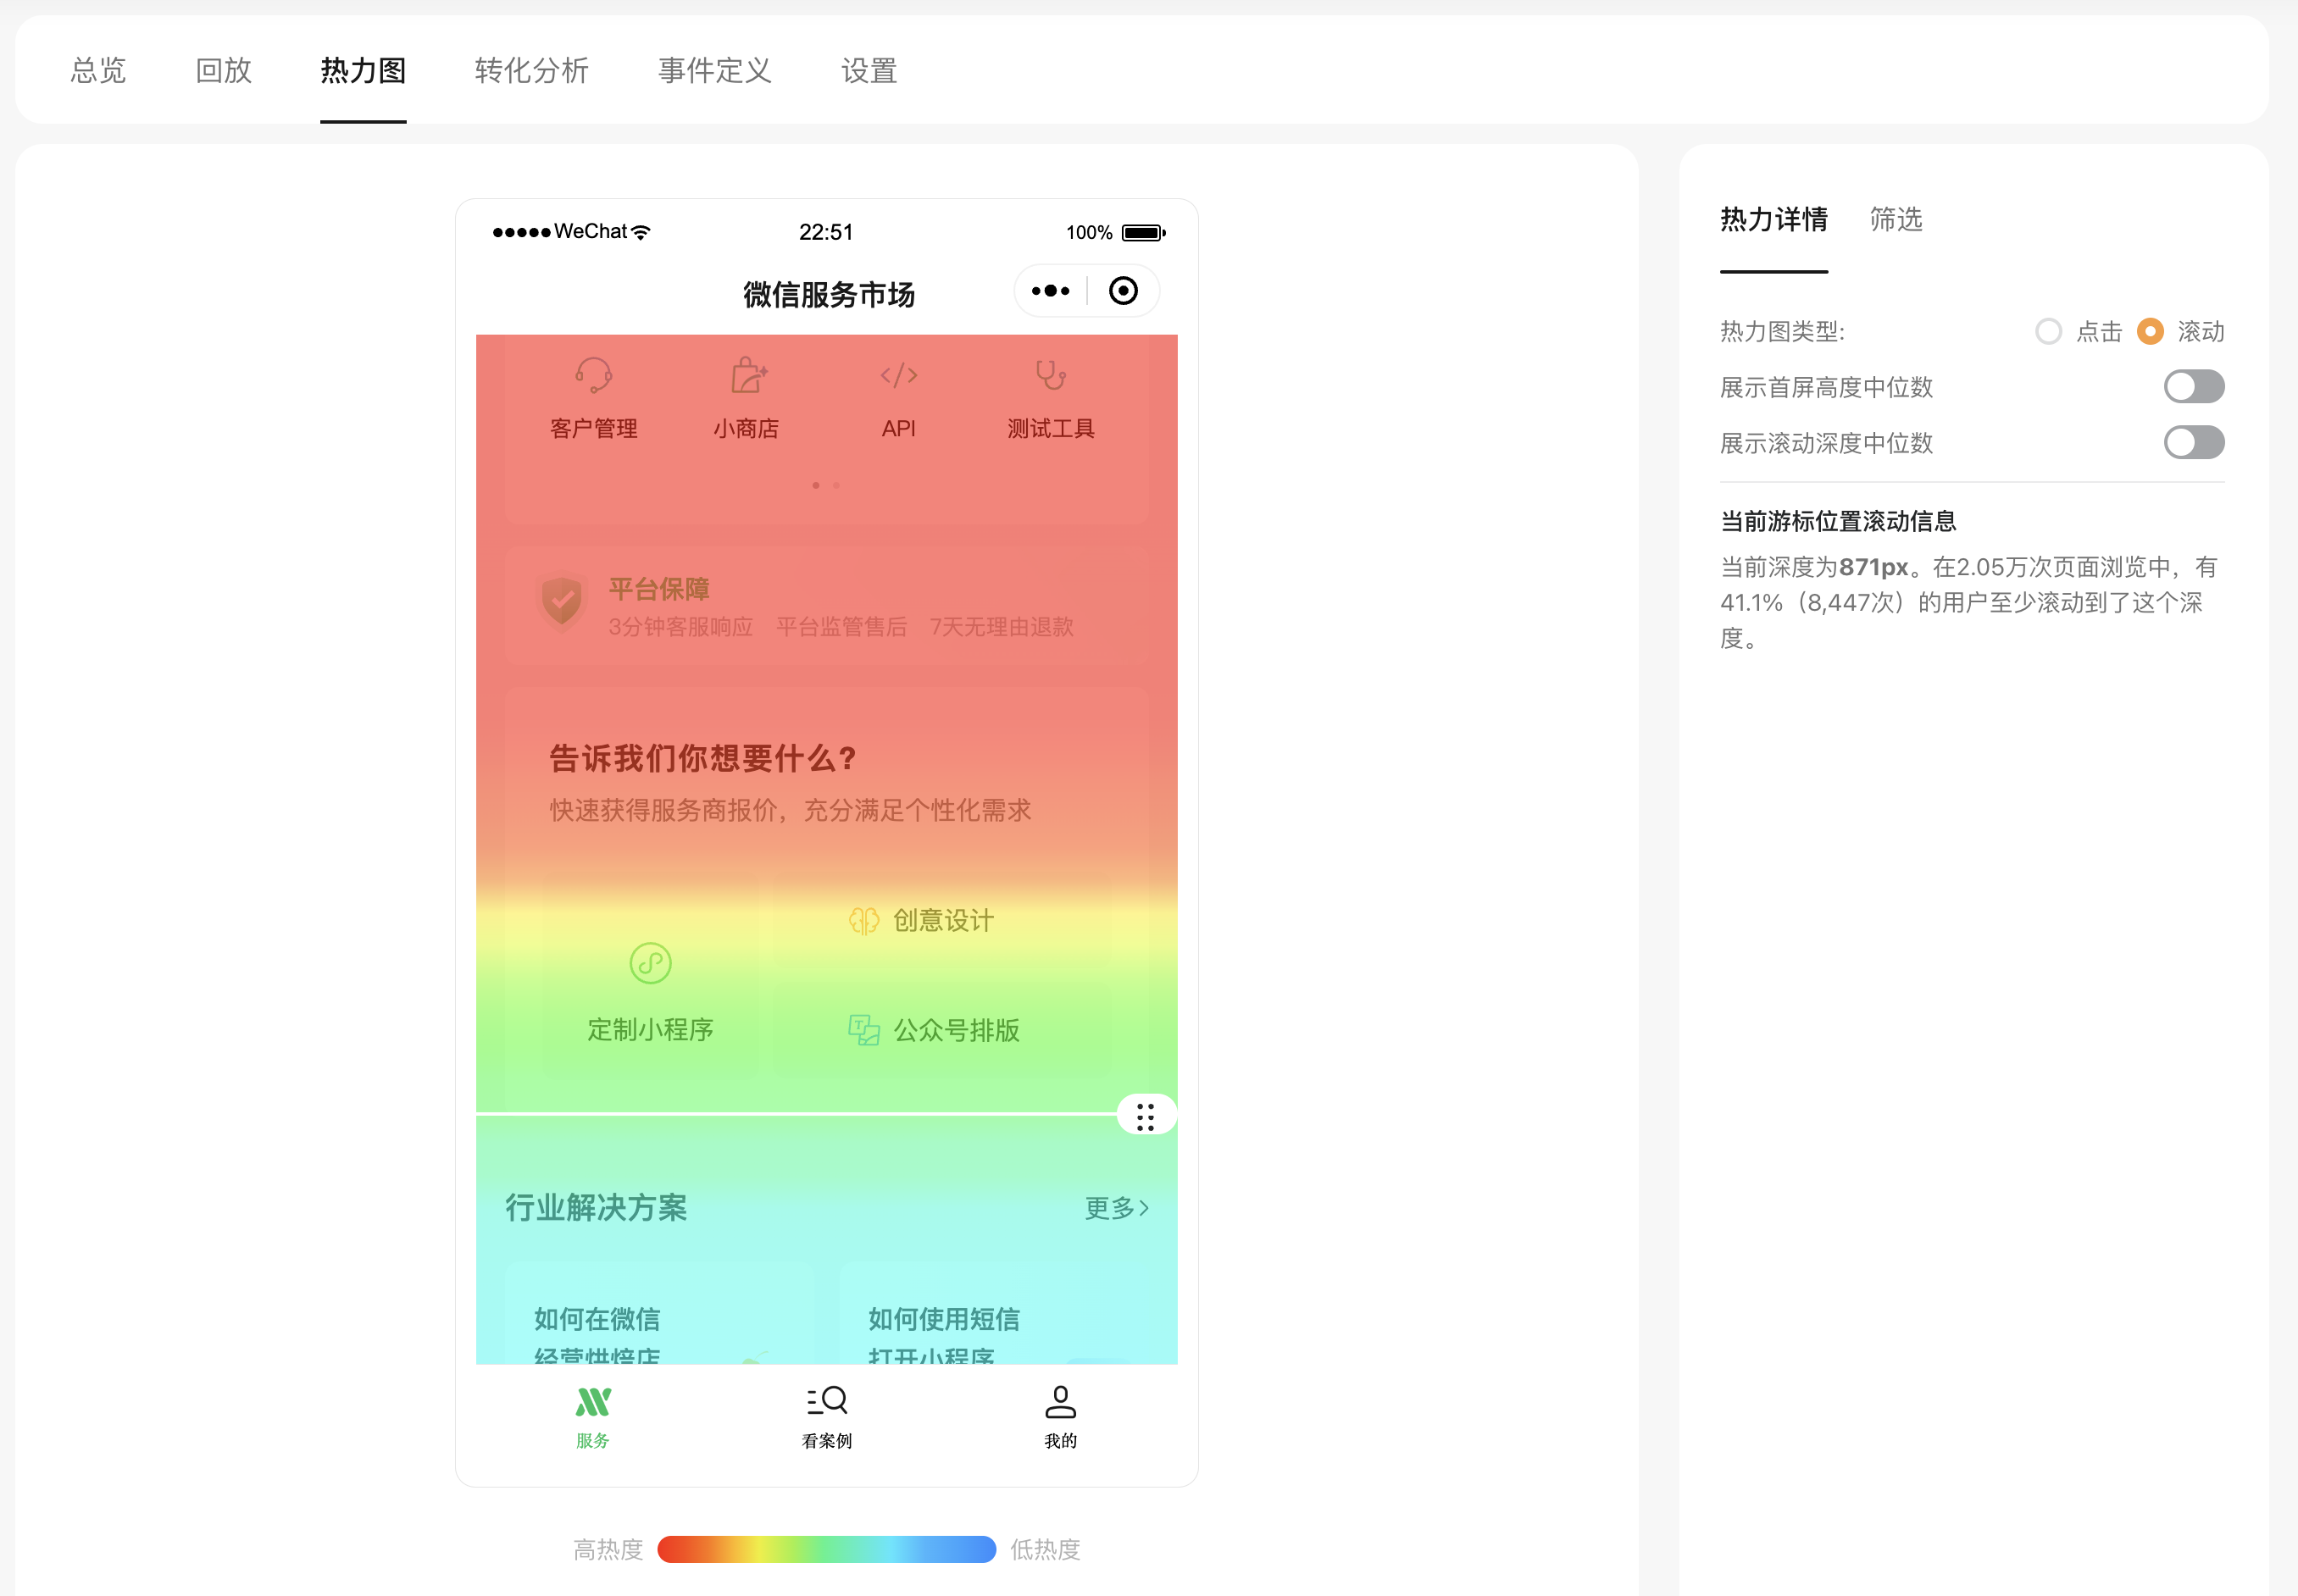
# Rolling heat diagram
Scrolling heat maps provides insight into the depth of the user's scrolling across various pages, thus intuitively confirming whether the first screen design is sufficiently attractive, the exposure of the sub-screen and below content, and other important product data to guide product optimization.
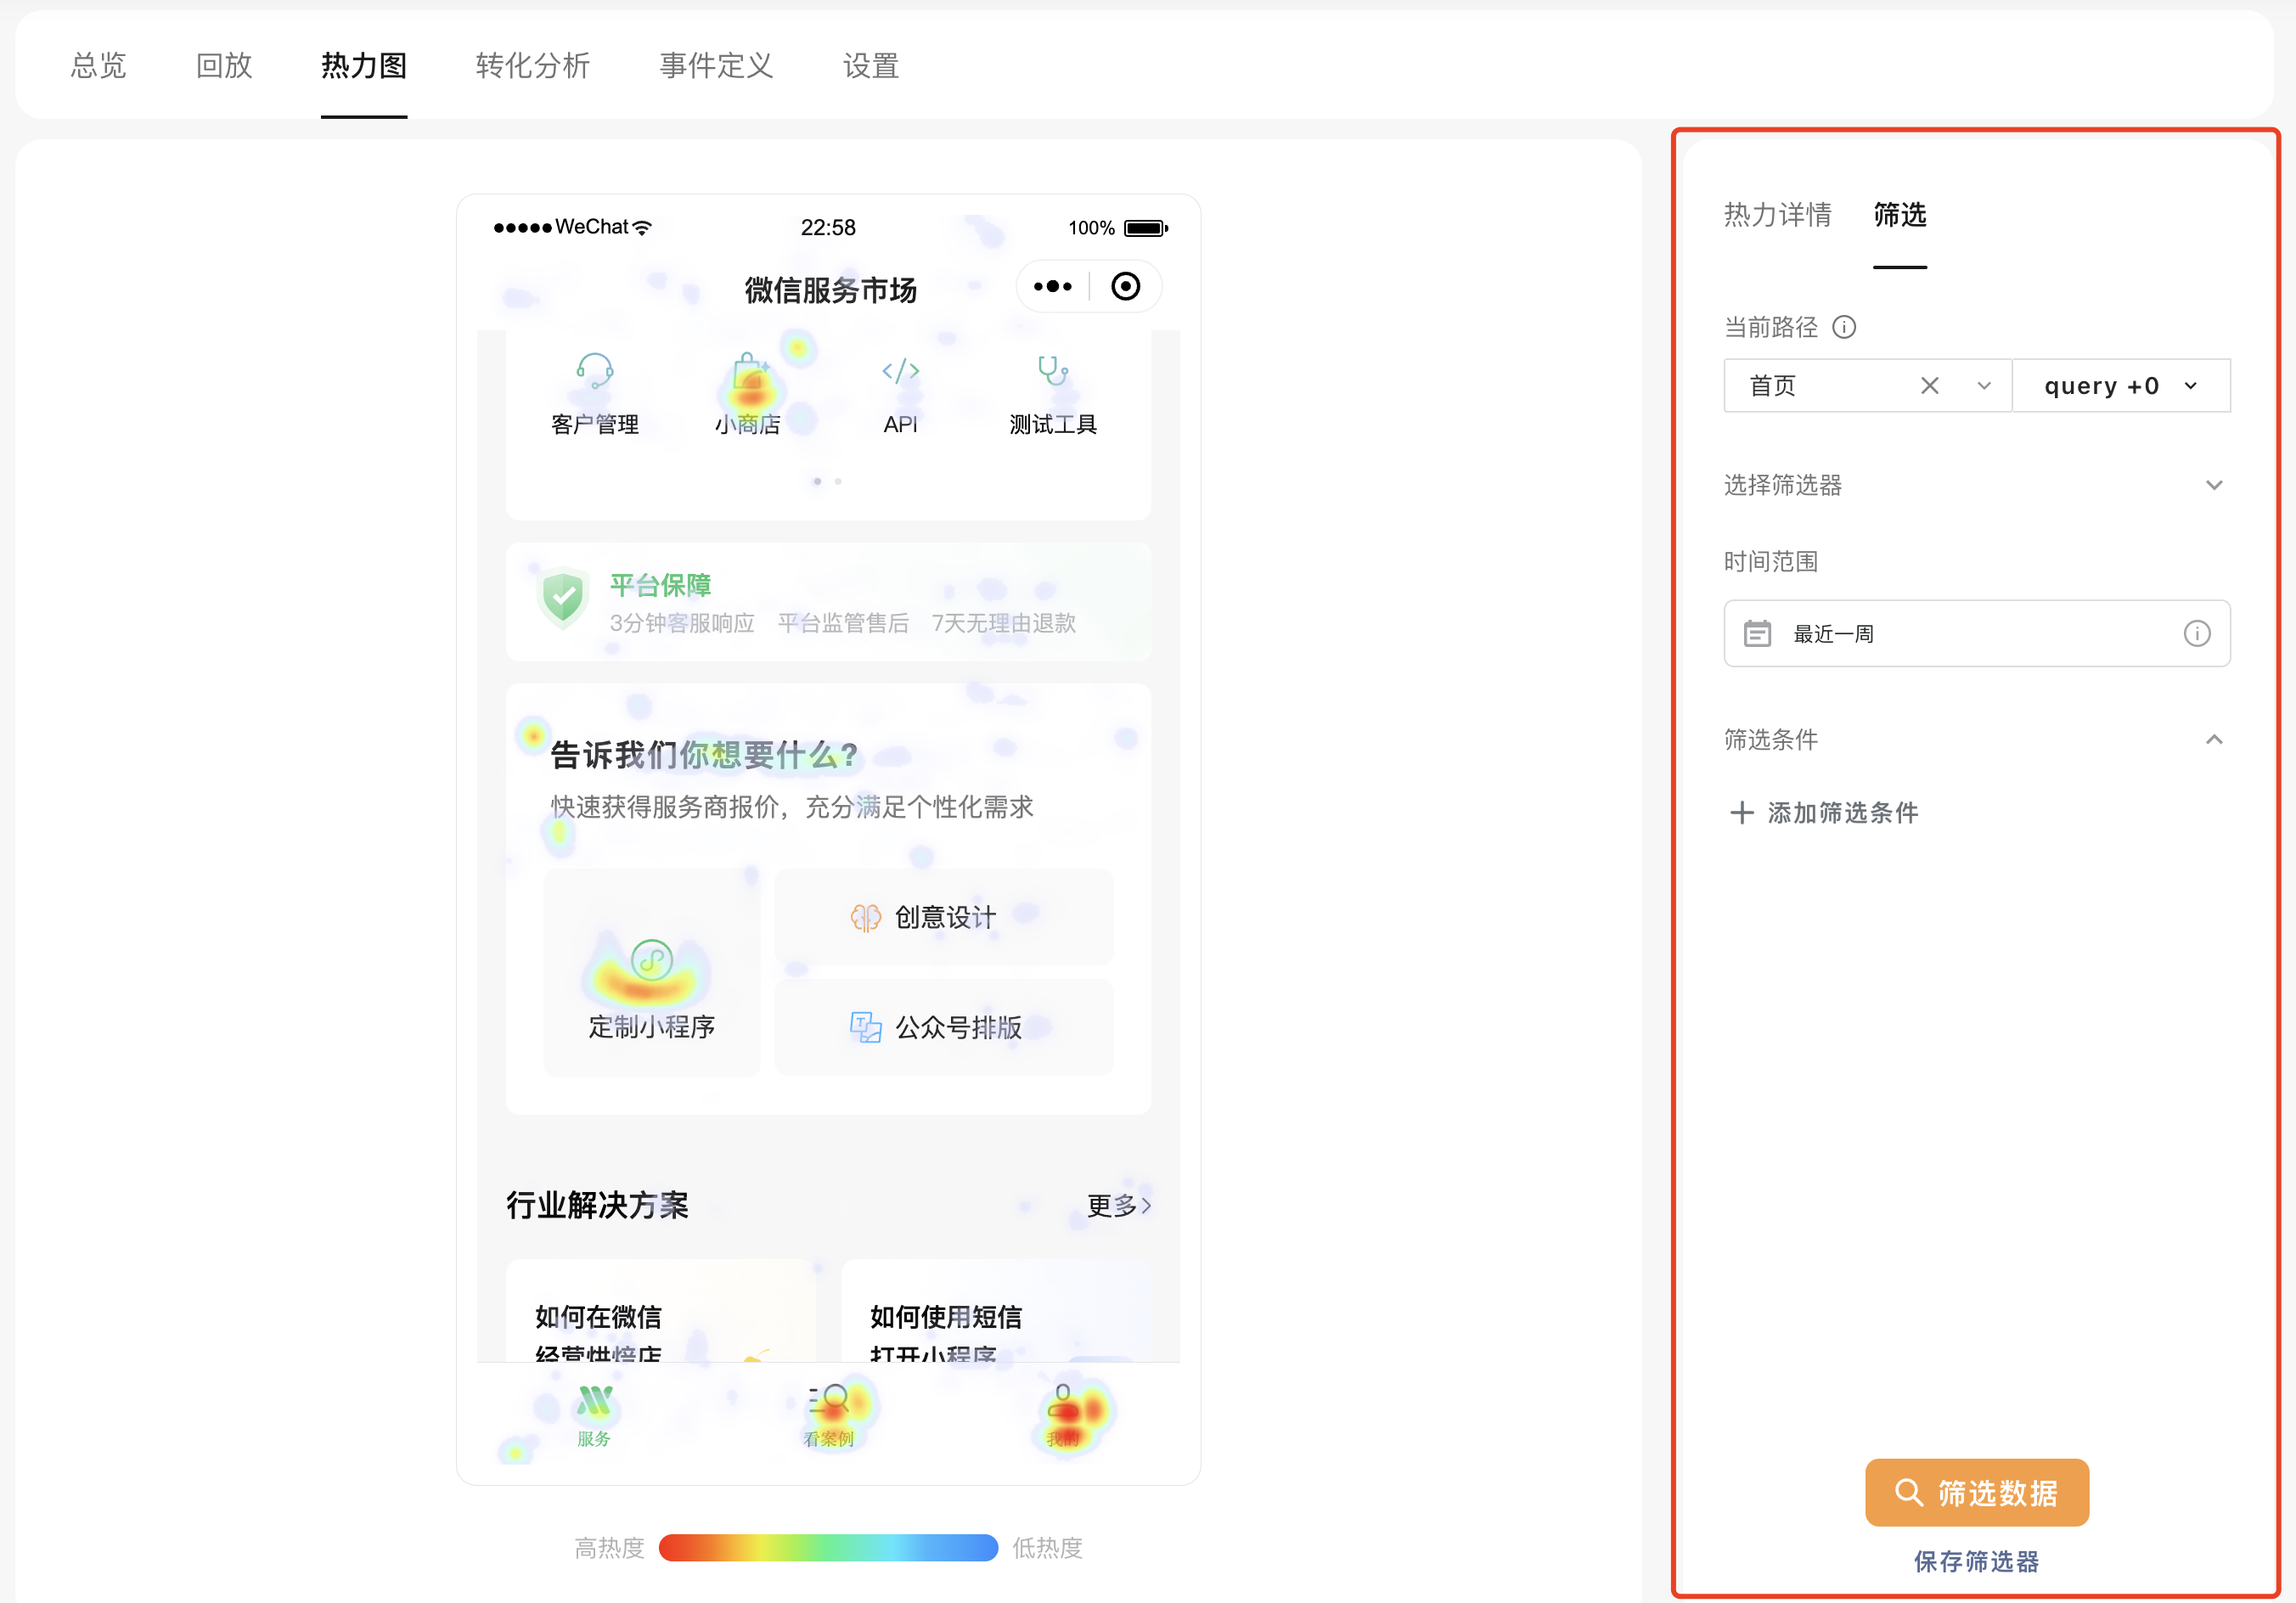
# Population screening
The right-hand filter can filter to see the heat map of different populations, supporting rich dimensions such as page query, operating system, Weixin Mini Program version, operational events, custom properties, custom events, and so on.