# Overview
# Yesterday's Overview

View yesterday's user KPIs, which provide a summary of the Mini Game's user activity, and compare the growth with the previous day, week, or month.
# Trend Overview
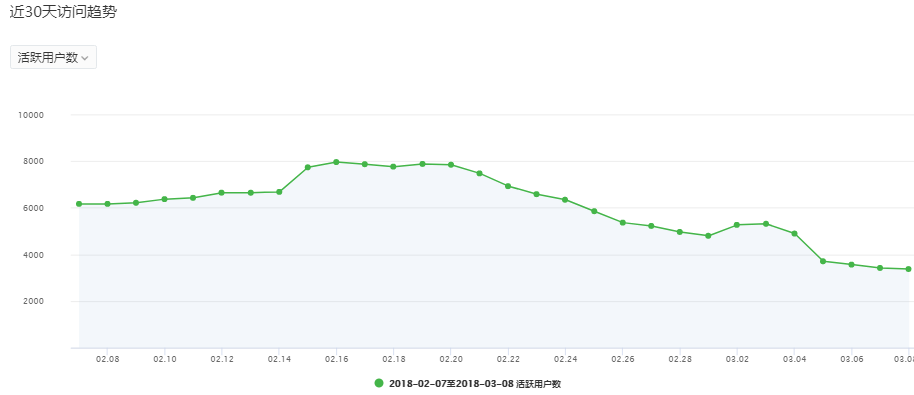
View the trends of KPIs, including visit trends for the past 30 days (active users, new users, subscribed users, and first-time subscribed users) and revenue trends for the past 30 days. For more details, see Glossary - KPI.
# Real-time Statistics
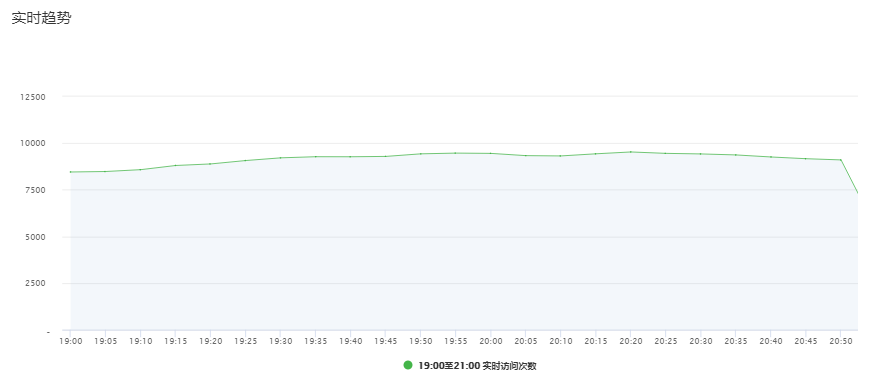
View real-time user visit data and trends. The time granularity is set at 5 minutes, allowing you to more intuitively observe trends in the data.
# Visit Analysis
# Visit Trend
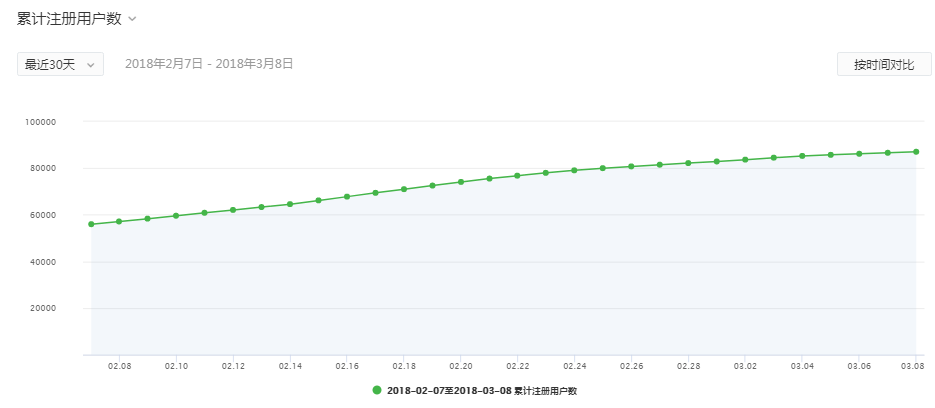
View user visit trends, including total registered users, active users, visits, new users, average stay per user, and user quantity analysis. For more details, see Glossary - KPI.
You can select the time granularity and view by day, week, or month. When the granularity is week or month, the values are accumulated totals, except in the case of user numbers, which refer to unique users.
# Visit Source
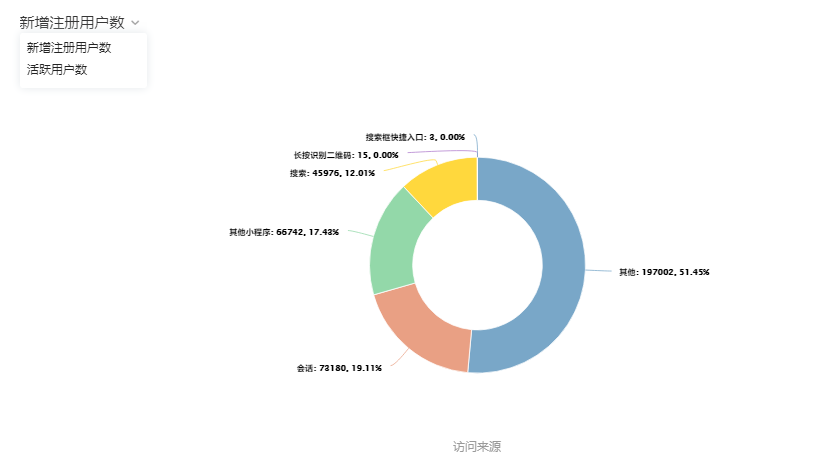
The visit source refers to the scenario by which users visit the Mini Game, such as from their Mini Program history or from a QR code. You can also check the number of times a Mini Game is opened in each scenario to analyze the channels through which users open the Mini Game.
# Visit Retention
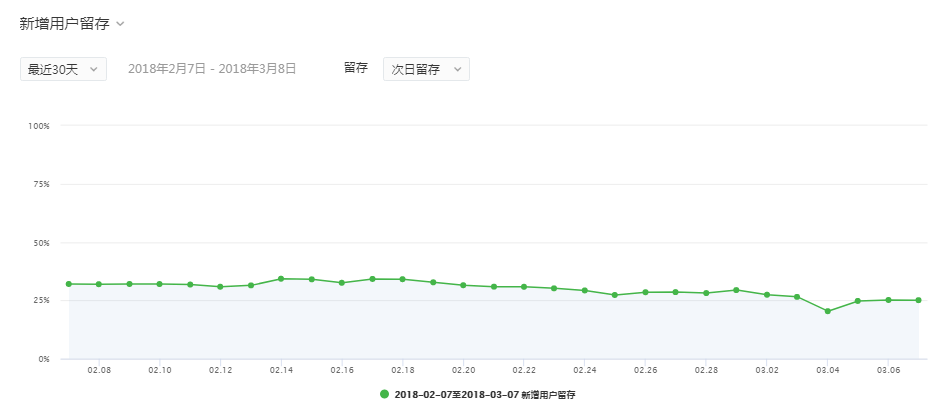
You can select the time granularity and view user visit retention by day, week, or month. When the granularity is week or month, the data reflects unique users.
New user retention: Calculate the percentage of users who revisit the Mini Game N days (or weeks or months) after first visiting the Mini Game. For example, if there were 100 users who visited the Mini Game for the first time on January 1, and by January 2, 10 of them are still visiting the Mini Game, then the next-day retention rate is 10.0%.
Active user retention: Calculate the percentage of users who revisit the Mini Game N days (or weeks or months) after actively visiting the Mini Game. For example, if there were 1000 users who visited the Mini Game on January 1, and by January 2, 300 of them are still visiting the Mini Game, then the next-day retention rate is 30.0%.
# Revenue Analysis
# Revenue Trends
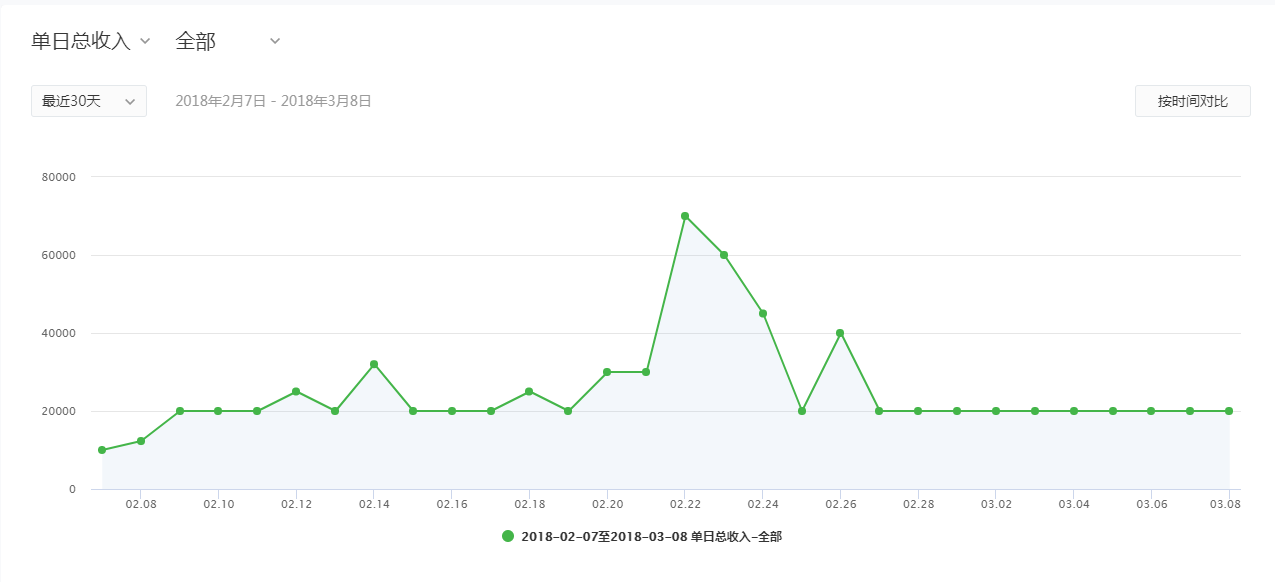
View data trends related to Mini Game revenue, including daily total revenue, total cumulative revenue, number of subscribed users, number of first-time subscribed users, penetration rate, average revenue per subscribed user, average revenue per user, and first-time payment ratio.
# User Portrait
View new and active user portrait distributions over a set time period. You can view data from the past 1, 7, or 30 days. New users are the number of unique users who visited the Mini Game for the first time within the set time period, while active users are the number of unique users who visited the Mini Game within the set time period.
# Gender and Age Distribution
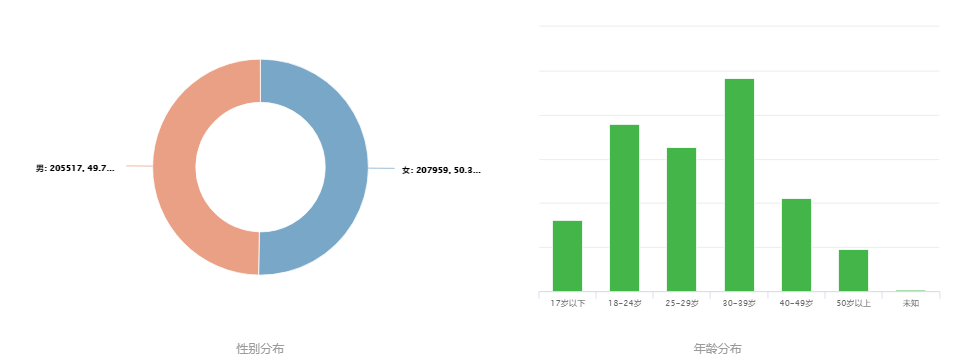 This feature allows you to view the gender and age distribution of new and active users. If user property data is incomplete, it may display as "Unknown".
# Region Distribution
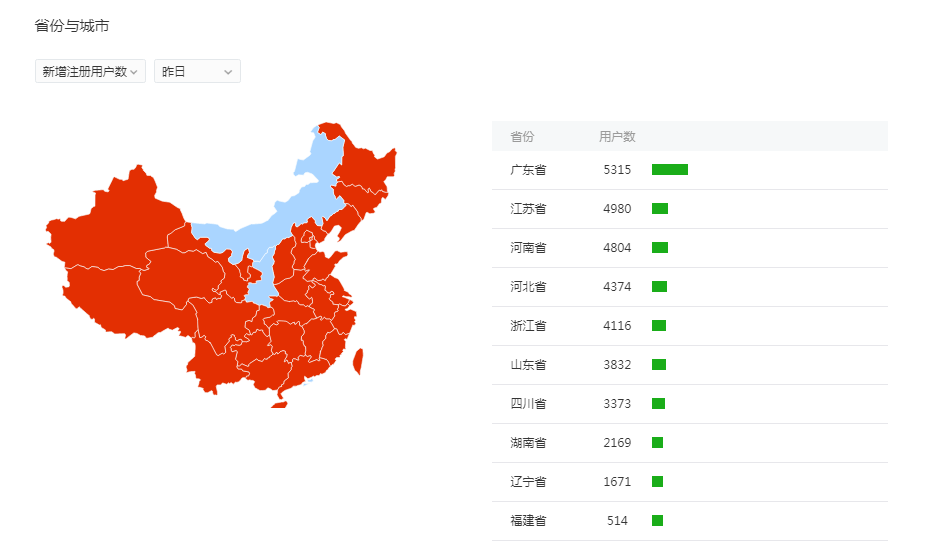
View the main provinces that new and active users come from. The diagram only displays the top 10 provinces.
View the main cities that new and active users come from. The complete data can be viewed at the bottom of the page or downloaded for further analysis. If user property data is incomplete, it may display as "Unknown".
# Mobile Platform and Device Model Distribution
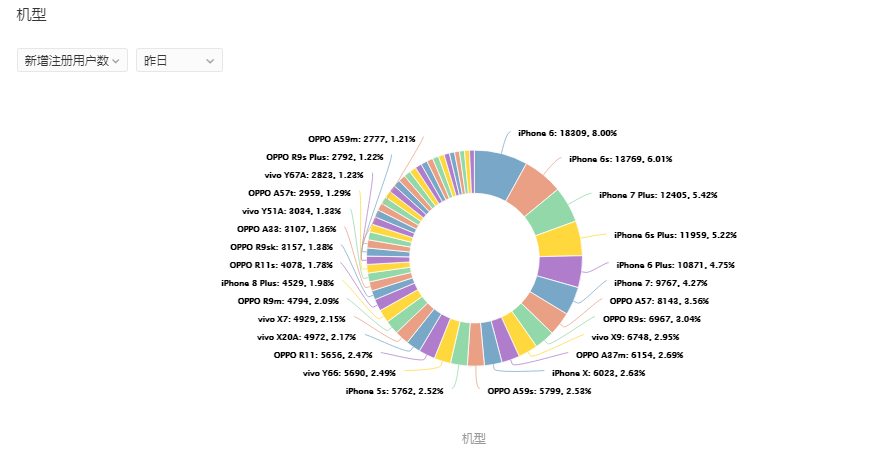
View the mobile platforms and device models used by new and active users. Mobile platforms include iPhone, Android, and other devices. If user device model data is incomplete, it may display as "Unknown".