Program debugging mainly has three functional areas: simulator, debugging tools and Mini Program operating area
# Simulator
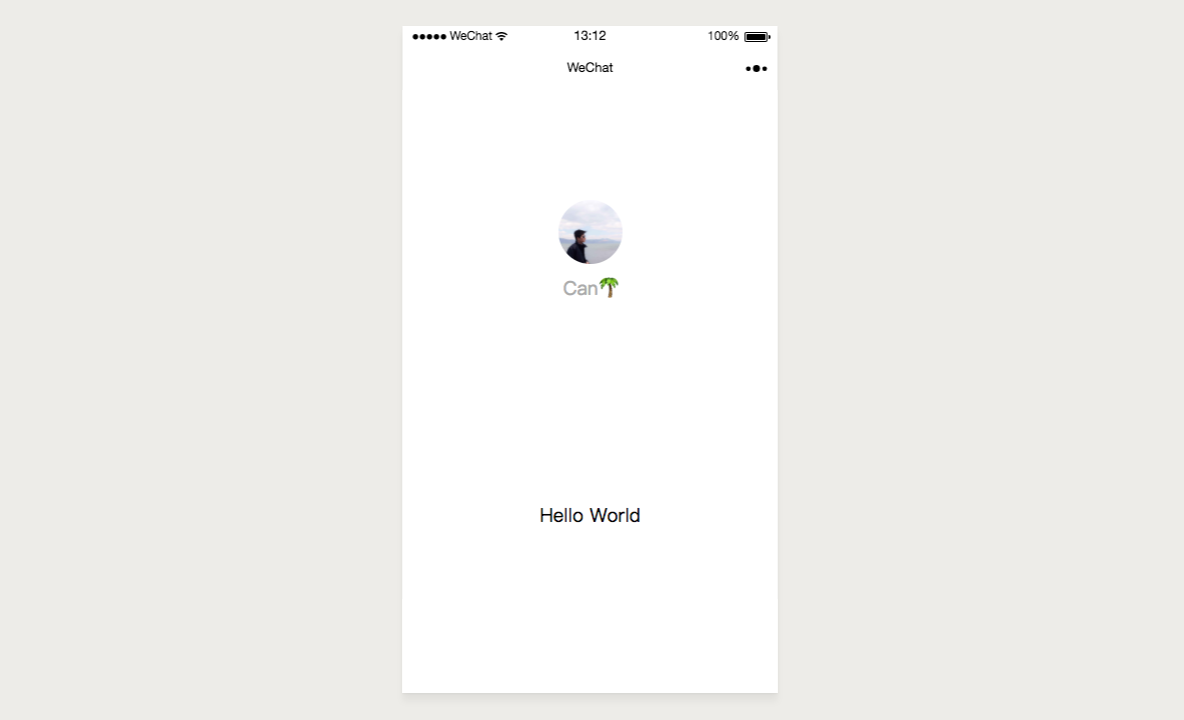
The simulator emulates the true logic of the Weixin Mini Program on the client, and it can display the correct state on the simulator for most APIs.
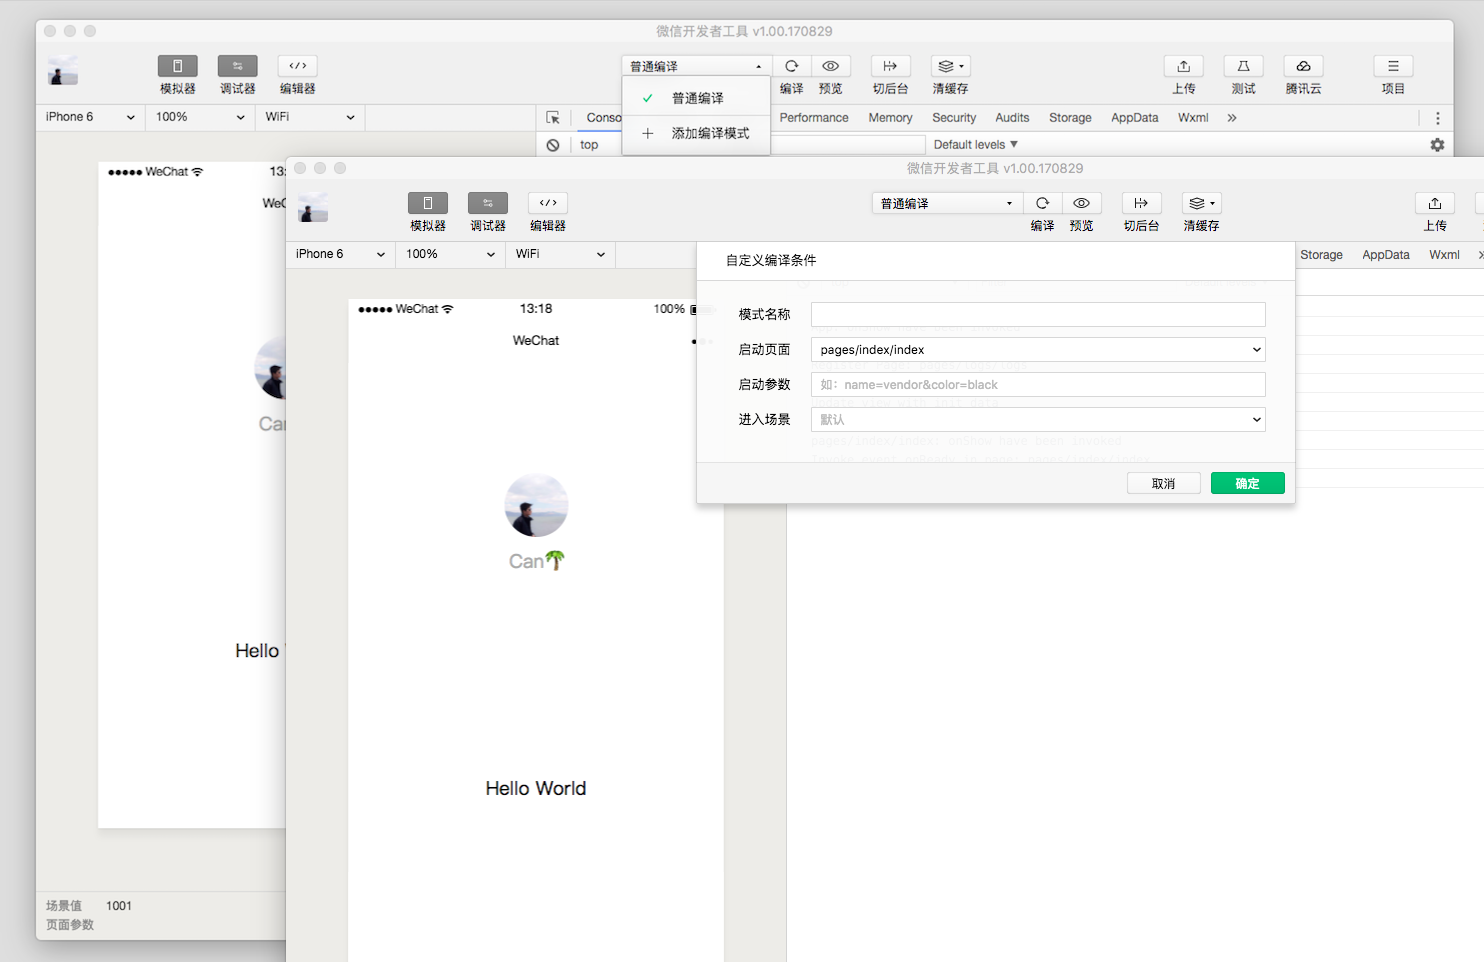
# Custom Compilation
Click the Compile button in the toolbar or use the shortcut Ctrl (⌘) + B to compile the current code and automatically refresh the simulator.
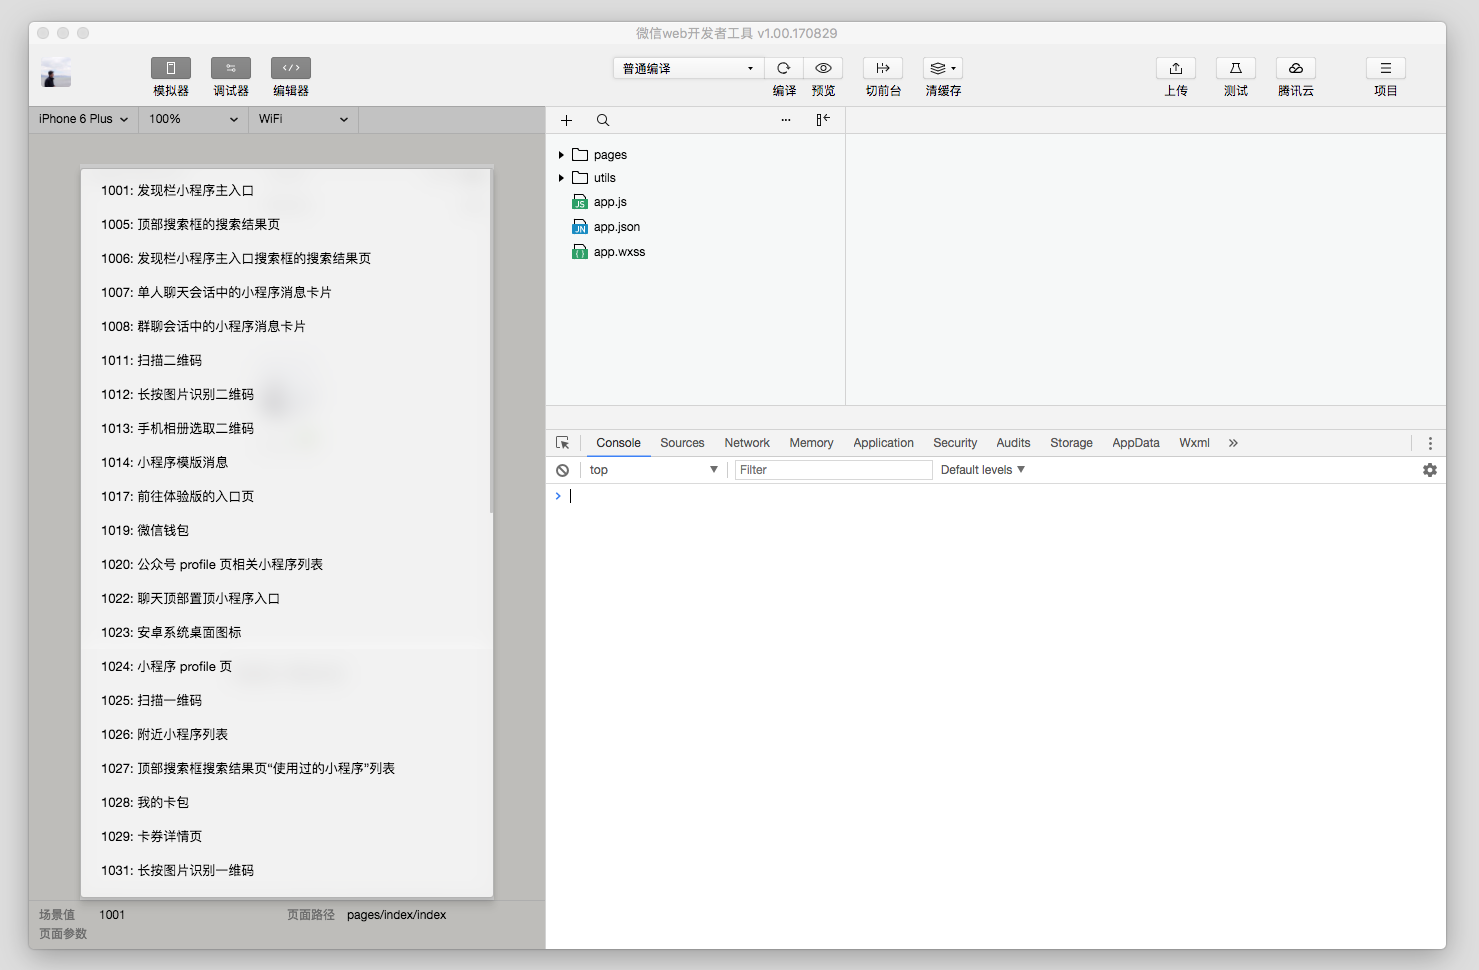
At the same time, in order to help developers debug the specific page from different scene values, developers can add or select existing custom compilation conditions to compile and preview the code (see figure).
Note: The compilation conditions are related to the project. Each project can save its own relevant compilation conditions
# Front and Back Switch
Front and back switch in the toolbar helps developers simulate some of the client's environmental operations. For example, when the user returns to the chat window from the Mini Program,Mini Program will be set as the background callback.
# Debugging Tools
The debugging tools are divided into 7 major functional modules: Console, Sources, Network, Appdata, Storage
# Sources panel
The Sources panel is used to display the script file of the current project. Unlike the browser development, the Weixin Mini Program framework compiles the script file. Therefore, the file the developer sees in the Sources panel is the processed script file. The code of the developer will be wrapped in the define function, and for the Page code, there will be an active call of require at the end.
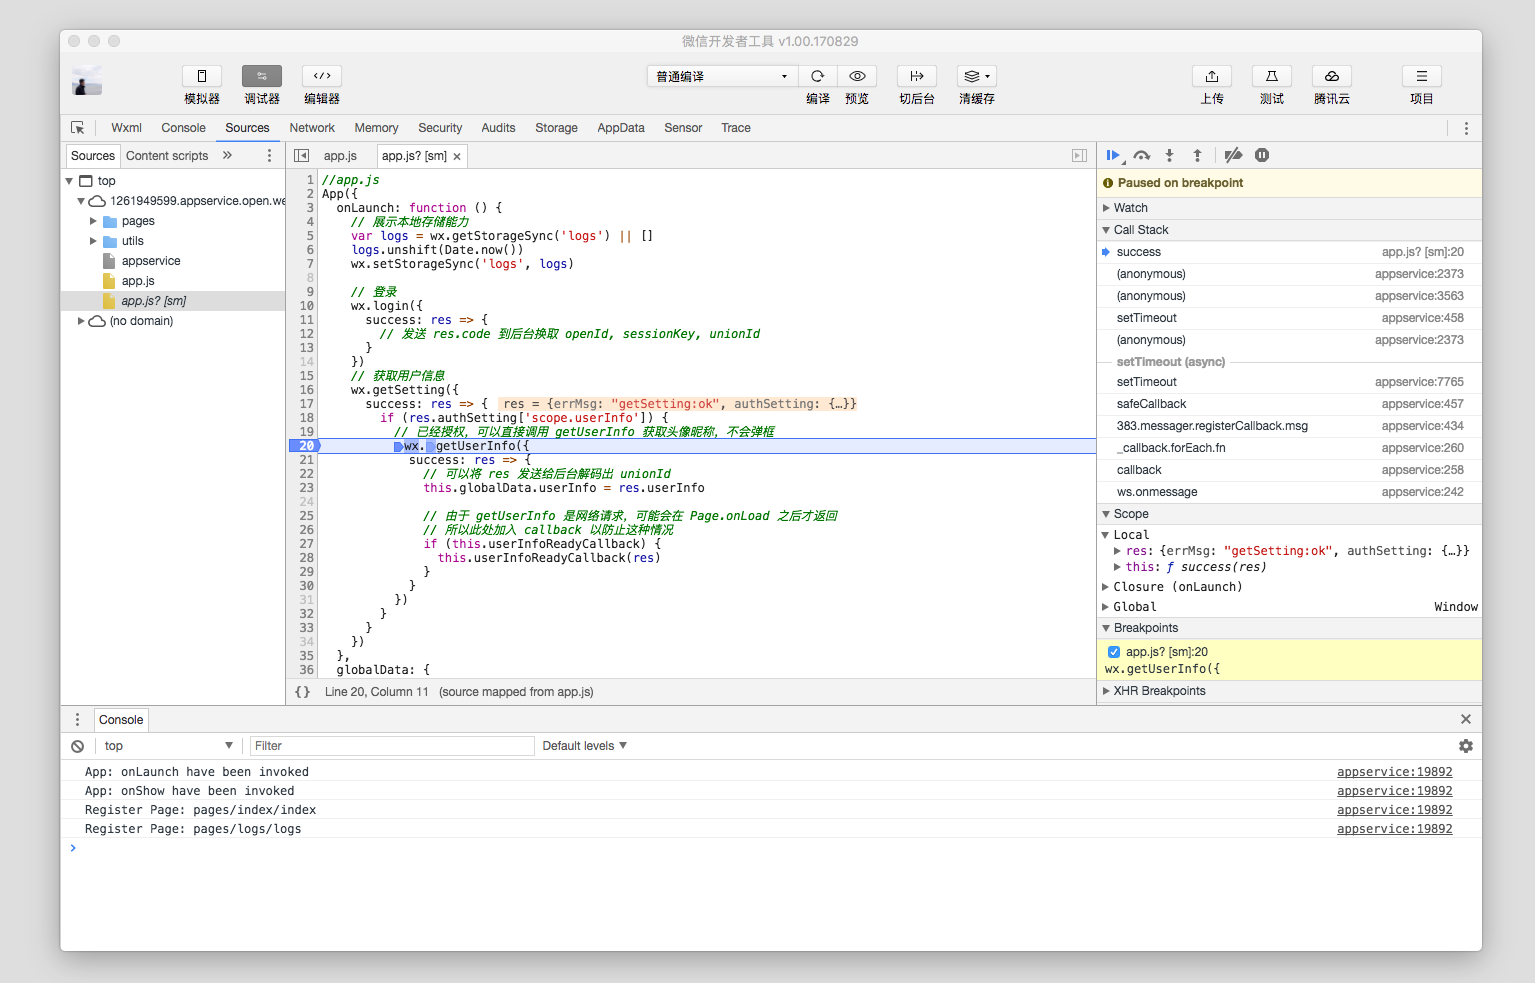
Note: When the code runs to the breakpoint, the entire Mini Program stops, so the simulator will appear blank or inoperable
# Storage panel
The Storage panel is used to display the data storage status of the current project using wx.setStorage or wx.setStorageSync.
Data can be deleted directly (press the Delete button), added and modified on the Storage panel .
# Network panel
Network Panel is used to observe and display request and socket requests
Note: uploadFile and downloadFile cannot be viewed in Network Panel for now
# Console panel
The Console panel has two major functions:
Developers can enter and debug code here
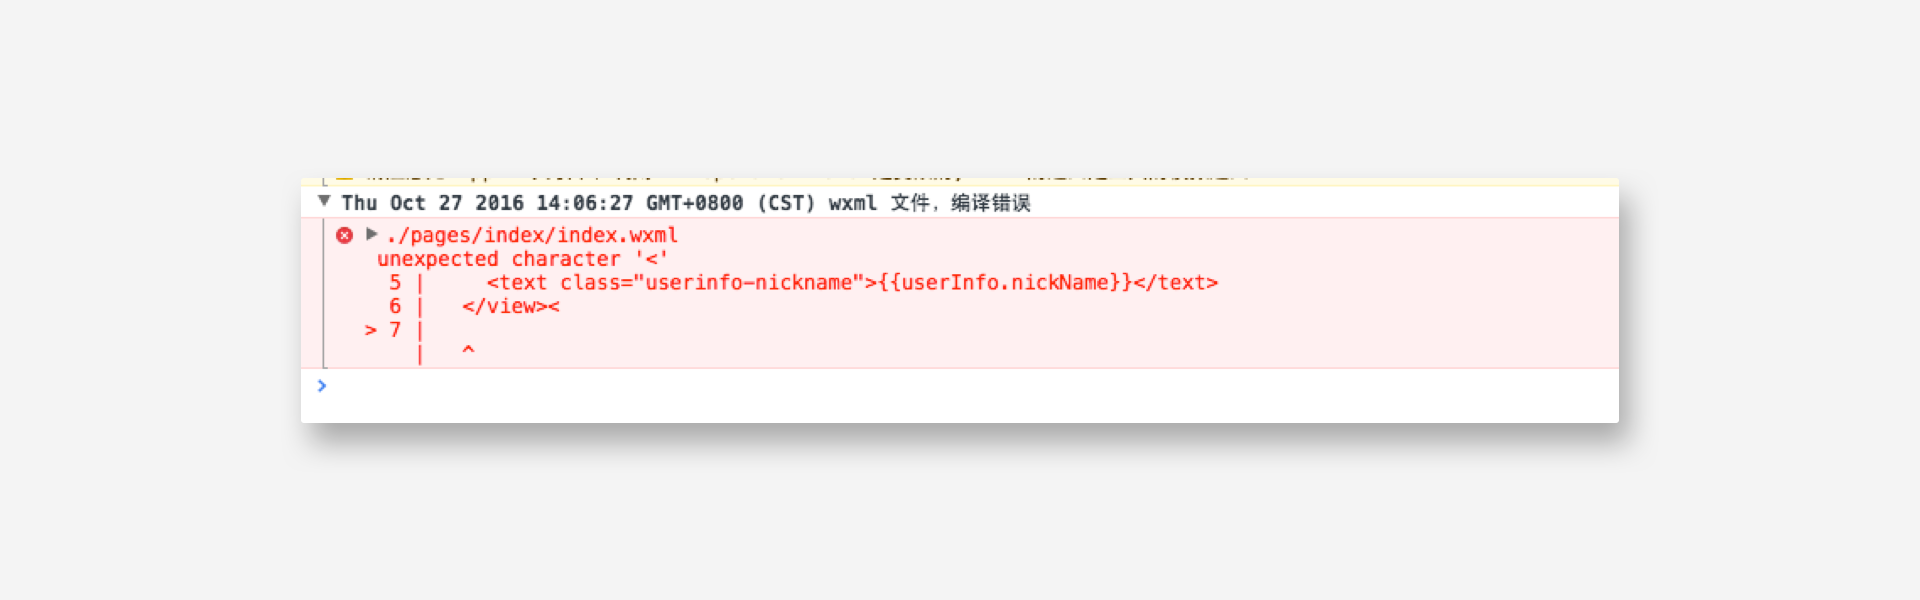
Error output from MIni Program will appear here
You can enter the following command in the Console
build: Compile Mini Program
upload: Upload code
openVendor: Open the base library in directory
openToolsLog: Open the tools log directory
checkProxy(url): Check agent usage for specified url