# Interface
# Startup Page
# Login Page
On the login page, you can scan the code via Weixin to log in to Developer Tools, and the Developer Tools will use this Weixin account information to develop and debug the Mini Program.

# Mode Selection
The Developer Tools offer two options for the Development model.
- Debugging of official account web pages. Selecting the debugging of the official account web page will directly enter the debugging interface of the official account web page project, and entering the URL in the address bar can debug the Weixin authorization and the Weixin JS-SDK function of the web page.
- Mini Program debugging. Select Mini Program Debugging to enter the Mini Program local project management page, you can create or delete the local project, or choose to enter the existing local project.

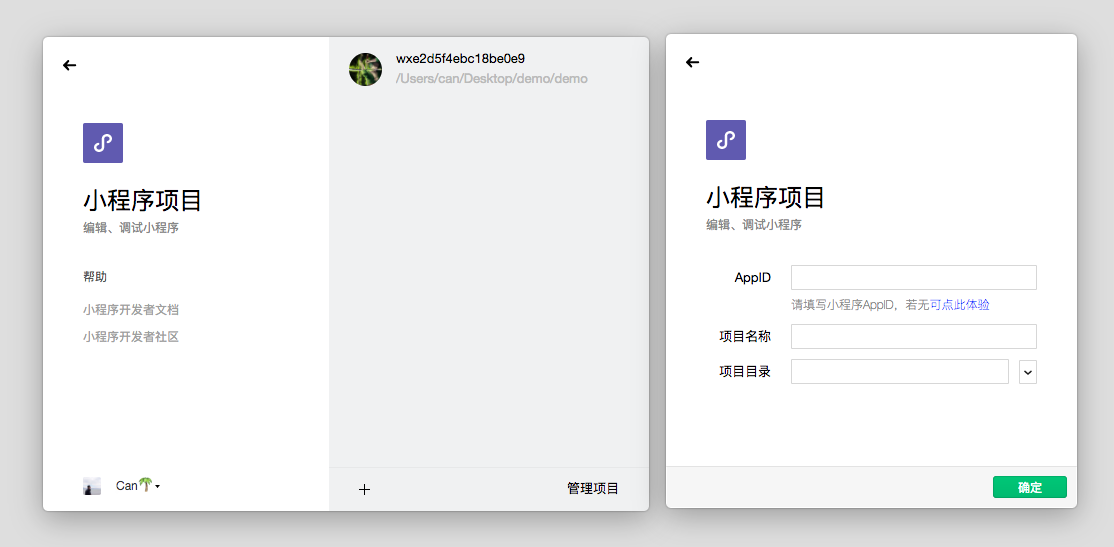
# New Project
A Mini Program project can be created locally when the following conditions are met:
- An [AppID] of the Mini Program is required(../README.md#1 - Get the -appid of the Weixin Mini Program); if you don't have an AppID, you can choose the Experience mode, but the Experience mode can't perform operations like code preview and upload, some API can not call normally;
- The logged-in Weixin ID needs to be the developer of the AppID;
- An empty directory needs to be selected, or there is
game.jsonorproject.config.jsonin the selected non-empty directory. When selecting an empty directory, you can choose whether or not to generate a simple project in that directory.
# Manage Project
Deletion and batch deletion for local projects

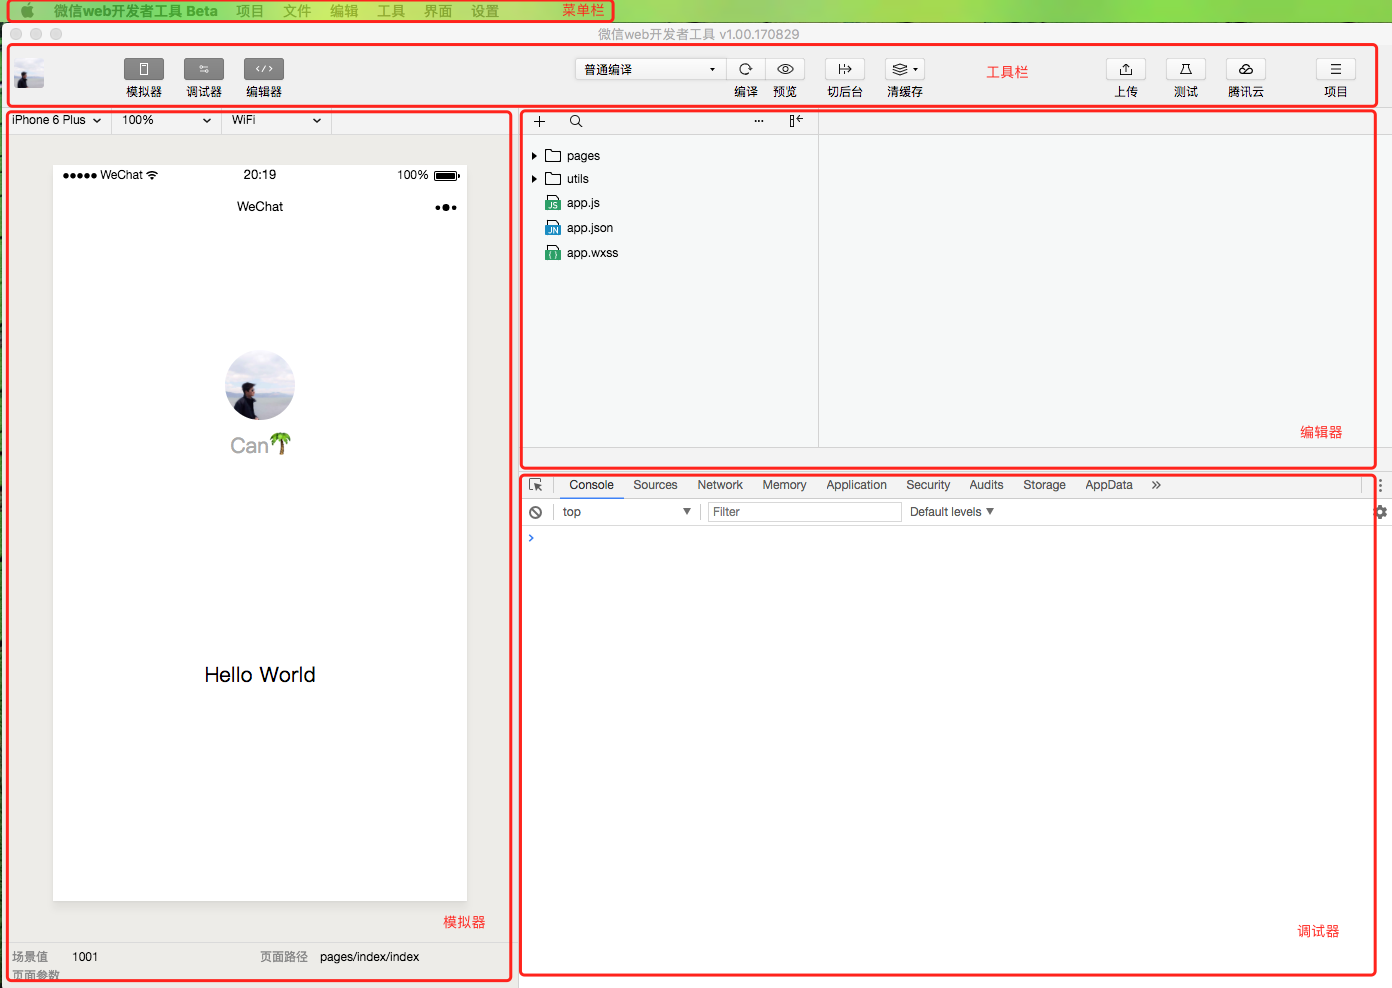
# Main Interface
The main interface of the Developer Tools, from top to bottom, from left to right, are five parts: Menu Bar, Toolbar, Simulator, Editor, and Debugger.
# Menu Bar
Weixin Web Developer Tools
Switch Account: Switch logged-in user quickly
About: About Developer Tools
Check for Updates: Check for version updates
Developer Forum: Go to Developer Forum
Developer Documentation: Go to Developer Documentation
Debug: Debug Developer Tools, debug Editor; If you encounter a bug that is suspected of Developer Tools or the Editor, you can open the debug tool to see if there is an error log, please feedback related issues on the forum
Replace Development Mode: Switch official account web page debugging and Mini Program debugging quickly
Exit: Exit Developer Tools
Project
New project: Create new project quickly
Open Recent: You can view the list of recently opened projects and select whether to enter the corresponding project
View All Projects : New window opens project list page of launch page
Close the Current Project: Close the current project, return to the project list page of the start page
File
New file
Save
Save All
Close file
Edit: You can view edit-related operations and shortcuts
Tool
Compile: Compile the current Mini Program project
Refresh: Consistent with the compiled function, keep the corresponding shortcut for historical reasons ctrl(⌘) + R
Compilation configuration: You can choose normal compilation or custom compilation conditions
Front and Back Switch: Simulate the client Mini Program to run in the background and return to the foreground
Clear Cache: Clear file cache, data cache, and authorization data
Interface: Control the display and hide of the main interface window module
Settings:
Appearance settings: Control editor's color theme, font, font size, line spacing
Edit Settings: Control file save behavior, Editor performance
Proxy Settings: Select direct network, system agent, and set proxy manually
Notification Settings: Set whether to accept certain type of notifications
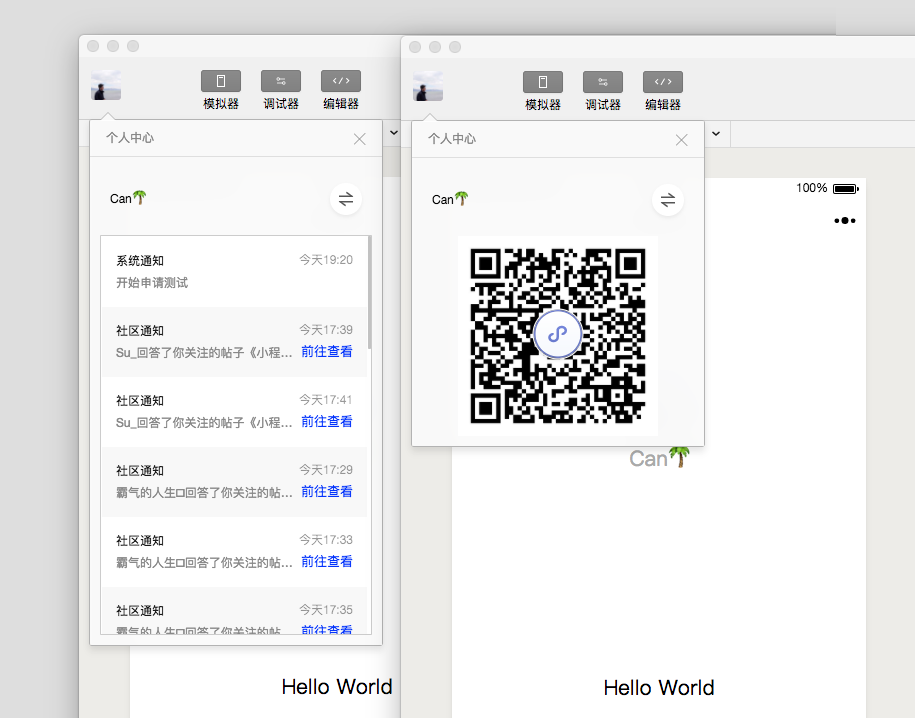
# Toolbar
Click on the user's picture to open the Personal Center, where you can easily switch users and view the news received by the Developer Tools.
The right side of the user's picture is the button that controls the main interface module to show/hide. At least one module is required to display.
In the middle of the toolbar, you can choose Normal Compilation, or you can create new ones and select custom conditions for compilation and preview.
By switching background button, you can simulate the situation where the Mini Program enters the background
The quick entry for cache cleaning is available on the toolbar. It can easily remove the file cache, data cache, and background authorization data on the tool to facilitate developer debugging.
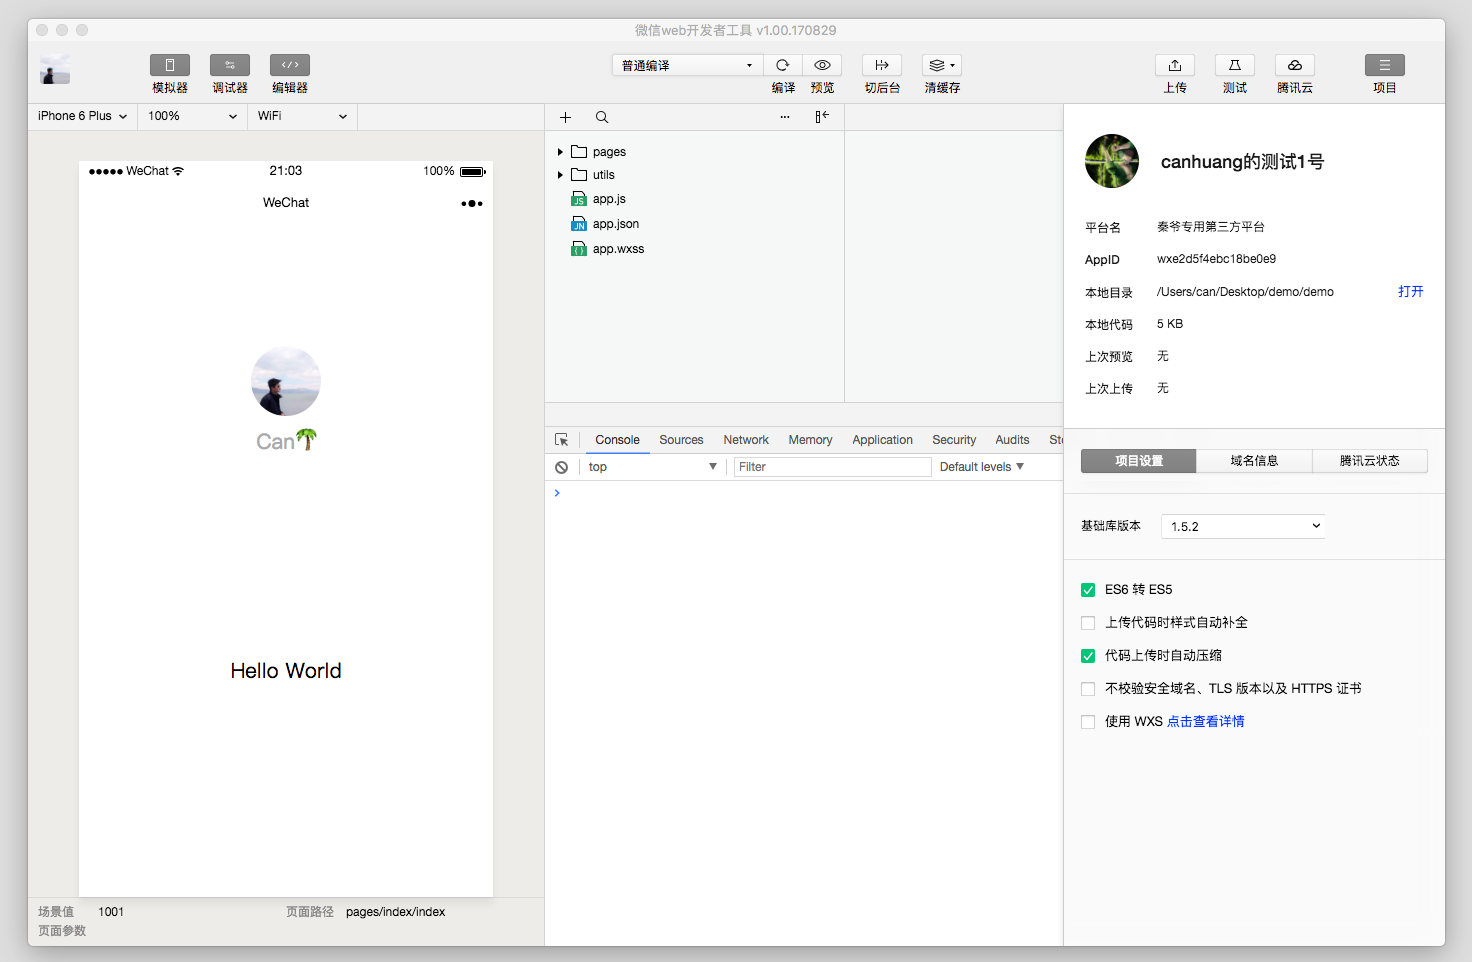
The right side of the toolbar is the area where development aids are available, where you can upload code and view project information
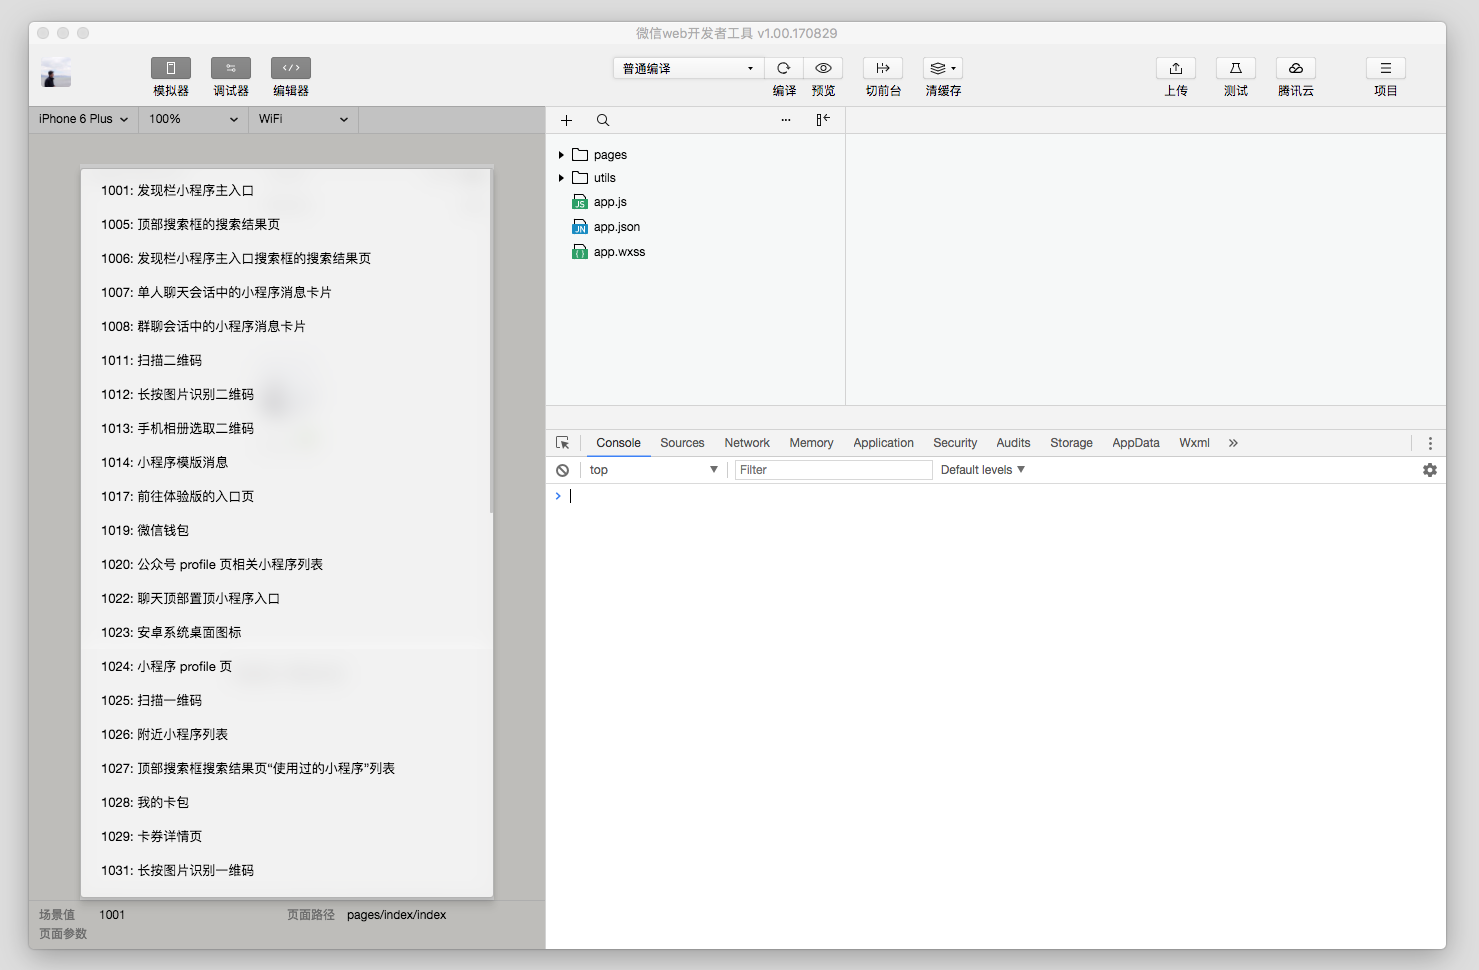
# Simulator
The simulator can simulate the performance of the Mini Program on the Weixin client. The code of the Mini Program can be run directly on the simulator after compilation.
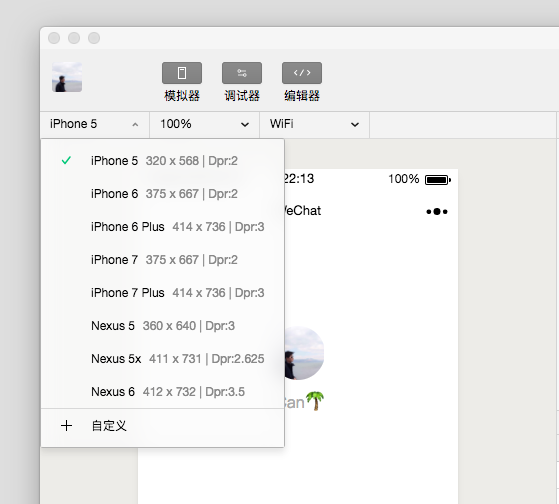
Developers can choose different devices, or they can add custom devices to debug the adaptation of Mini Program on models of different sizes.
In the status bar at the bottom of the simulator, you can see the scene value, page path, and page parameters of the currently running Mini Program intuitively