There are three main functional areas for debugging programs: analog device, debugging tool and Weixin Mini Program operating area
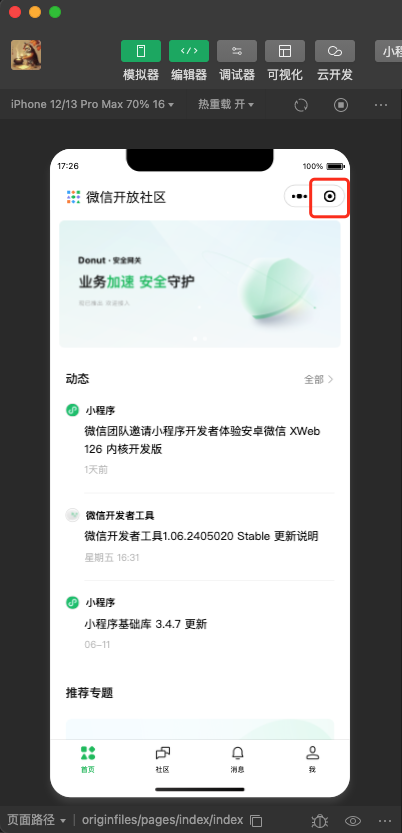
# simulator
Mimicry simulation Weixin Mini Program in the real logic of the terminal, for the vast majority of the API can be displayed on the mimicry correct state.

The Developer Tools Emulator provides a range of simulation operations
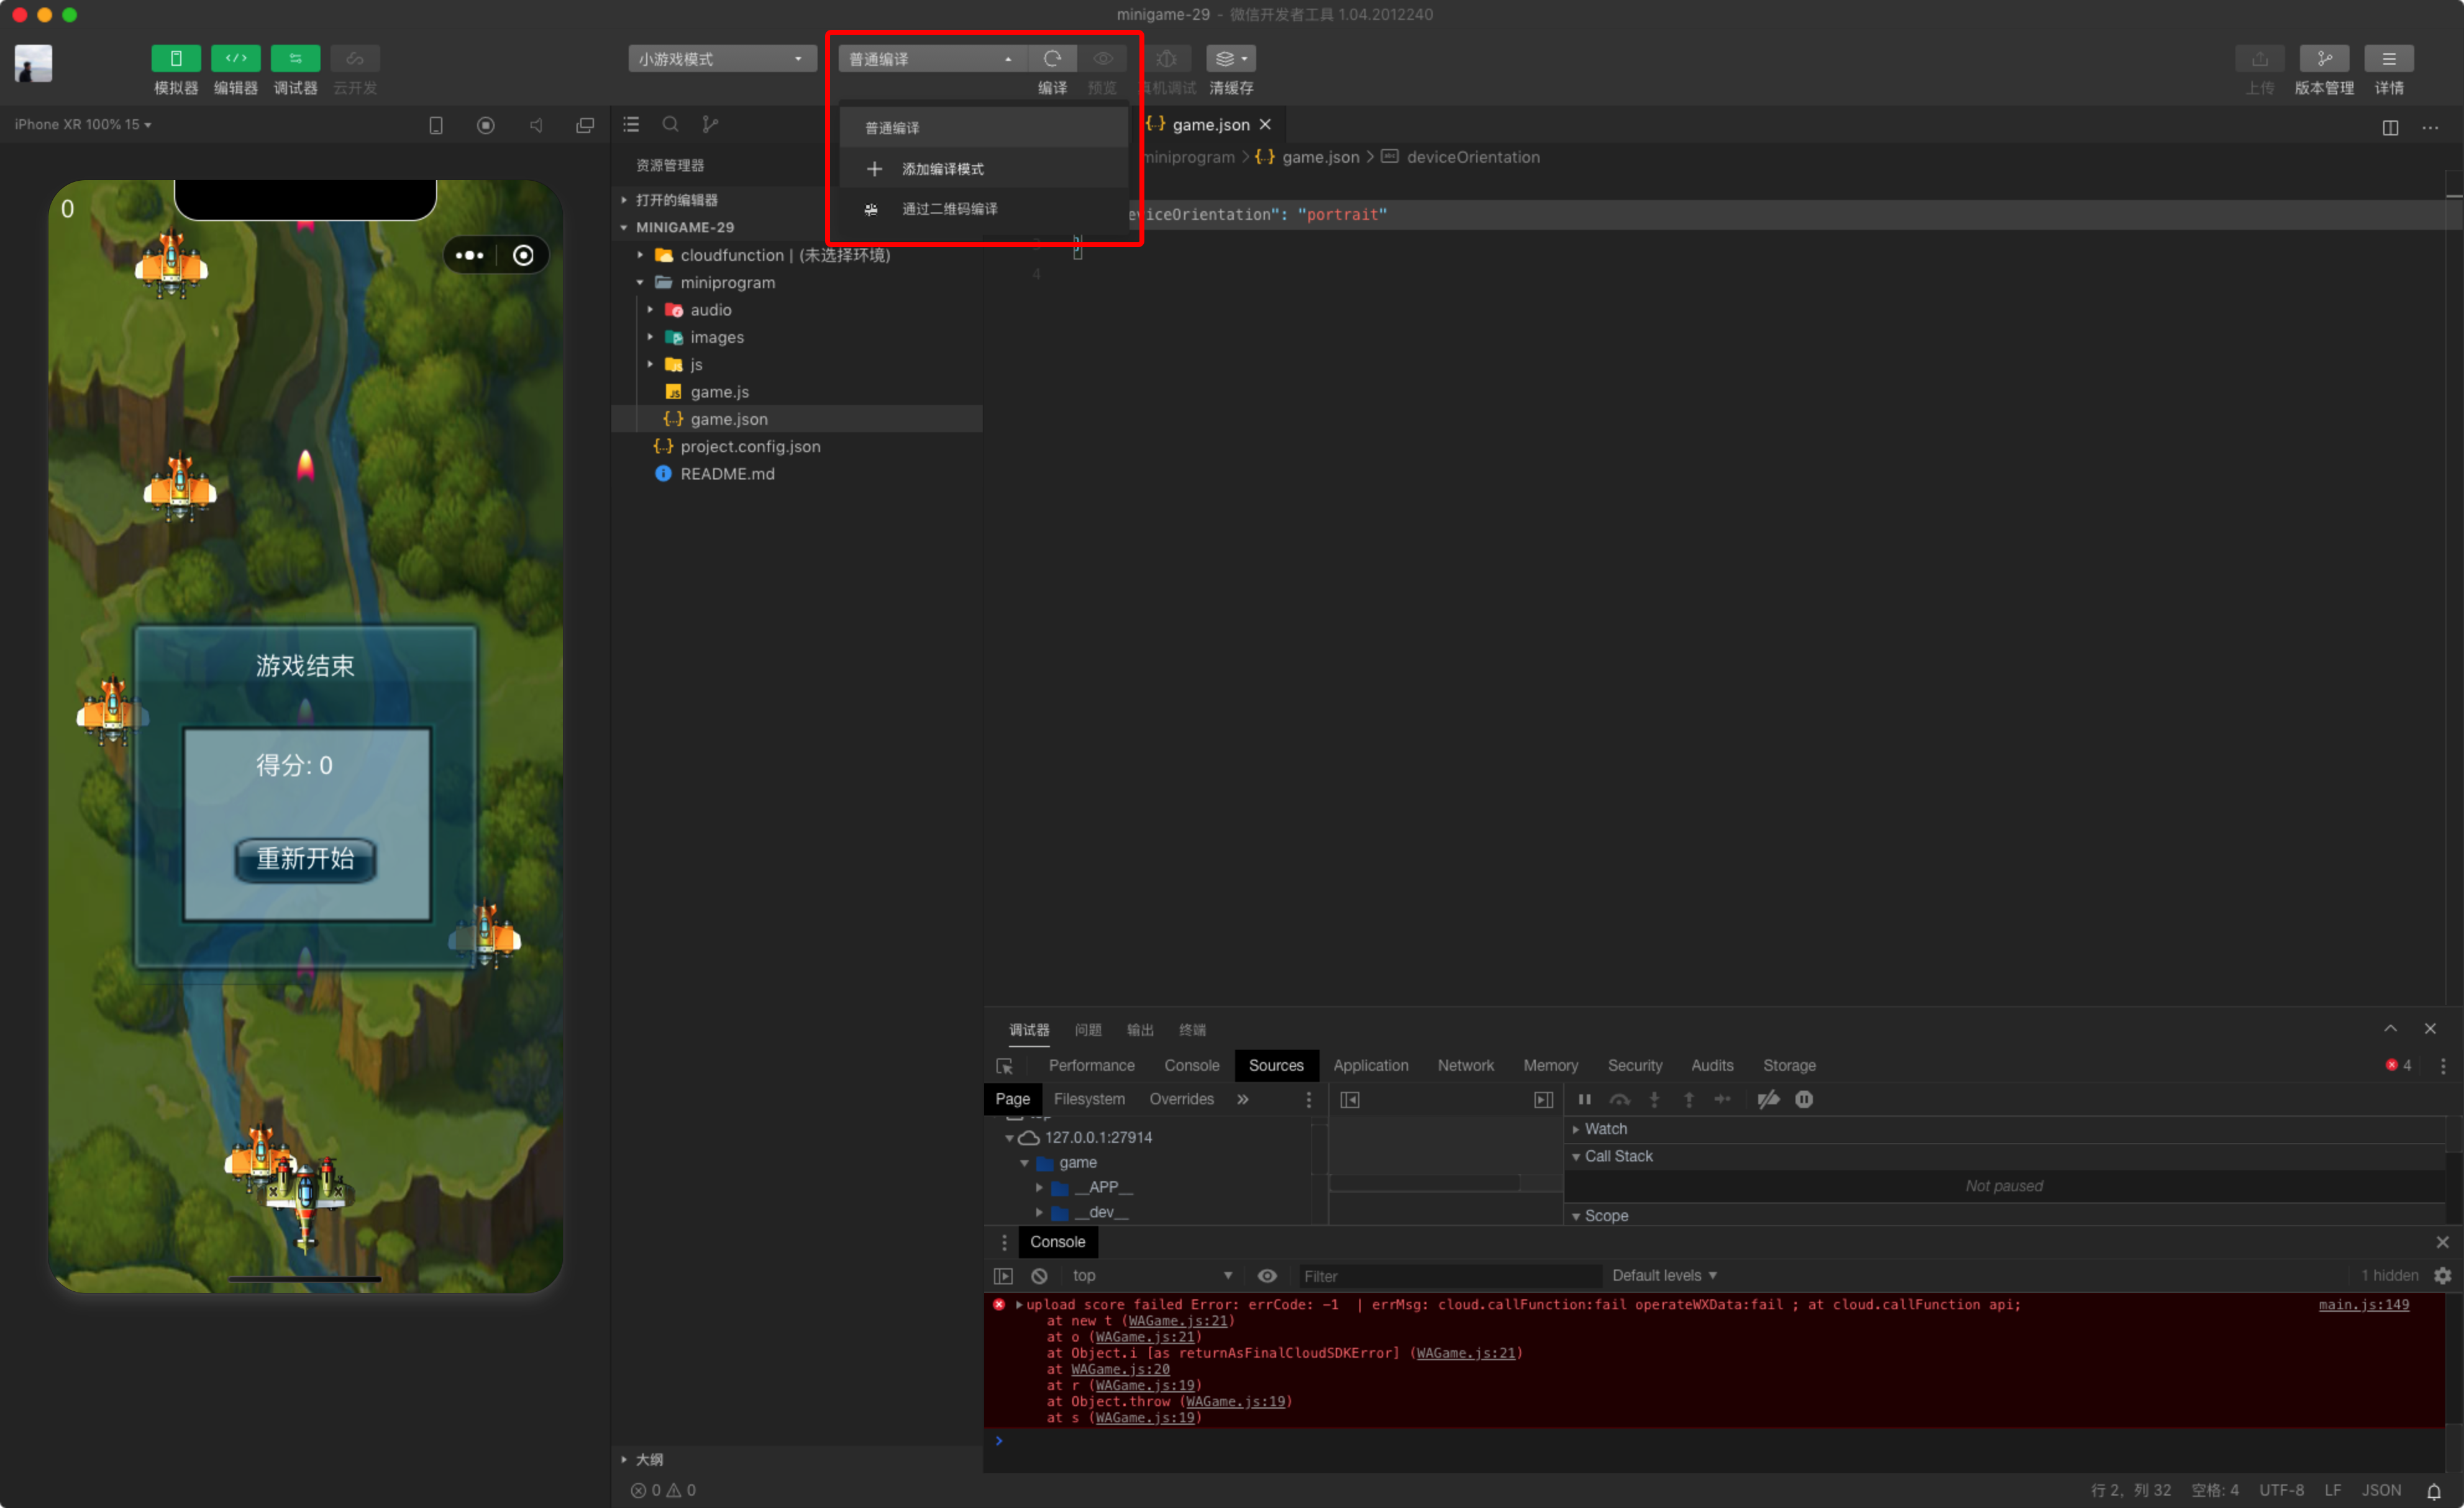
# Custom compilation
Clicking the compile button or using the shortcut key Ctrl () + B in the toolbar compiles the current code and automatically refreshes the emulator.
At the same time, to help developers debug from different scenario values to specific pages, developers can add or select custom compilation conditions that already exist for compilation and code preview (as shown in the figure).
Note: Compilation conditions are related to the project, and each project can save its own compilation conditions
# Compile exception information
Compilation exceptions may appear during preview or upload.
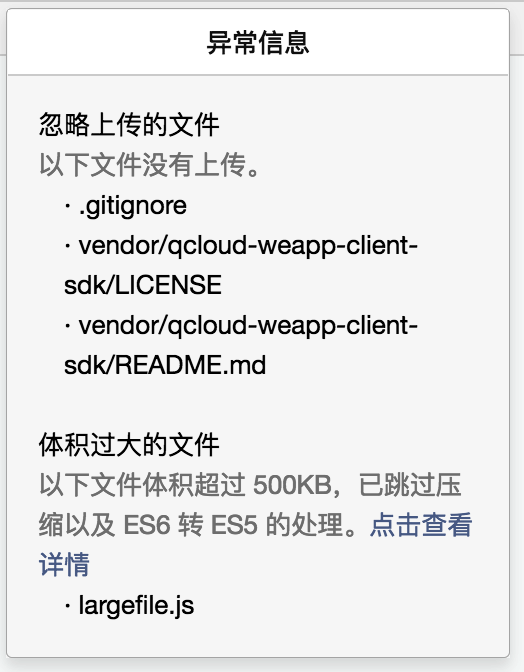
Ignore uploaded files: Some files under the project folder may not be necessary for Weixin Mini Program to run, such as readme documents,.gitignorefiles, etc.To optimize the size, these files will not be packaged during the preview and upload process.
Large files: If the ES6 to ES5 or code compression option is ticked off, the tool skips processing certain large JS files to optimize compilation speed.
# Custom Pre-processing
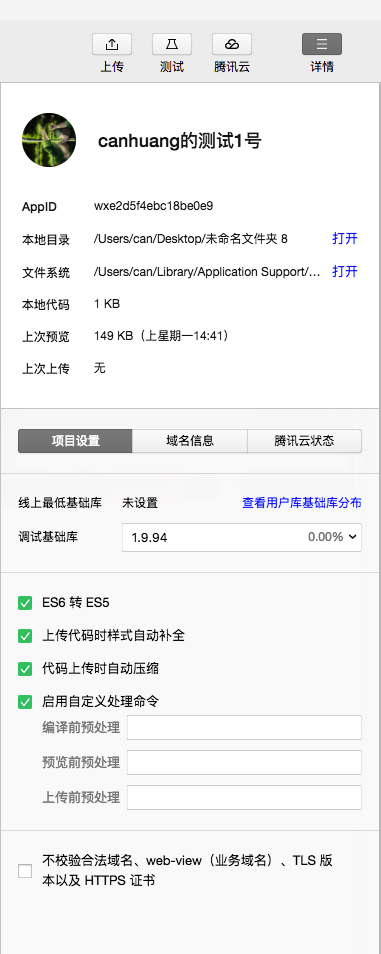
In project setup page cards, we provide the following default preprocessing to solve most of the code file preprocessing problems
- ES6 to ES5 (can be applied to compile, preview, upload), using "babel-core": "^ 6.26.0"
- Style autocomplete when uploading code, use "postcss": "^ 6.0.1"
- Automatically compress when uploading code. Use "uglify-js": "3.0.27"
For advanced developers, it is perfectly possible to write automated build scripts of their own to preprocess code files, so we provide theoption to enable custom processing commands andoption
Developers can specifycommands that need to be preprocessed before compiling / previewing / uploading
The developer tool uses the shell to run the specified command and outputs the command execution log in the console
Execution order of preprocessed commands
- Custom preprocessing commands
- Default preprocessing command
- Compile / preview / upload
Note:
- The preprocess command is triggered by manually clicking the "Compile" button or by using the shortcut key to compile. File modification cannot trigger this command.
- The Mac version of the developer tools cannot reuse the Path loop variable in bash. You may need to manually set the system's Path loop variable to properly execute the command.
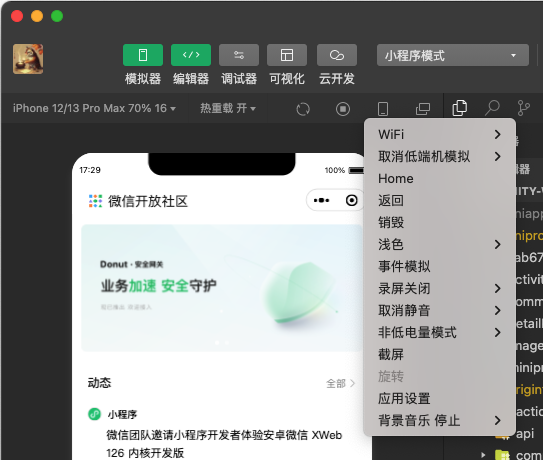
# Analog operations
The back and forth switching in the toolbar helps developers simulate some of the client's environment actions.For example, when the user returns to the chat window from Weixin Mini Program, an Mini Program will trigger a callback that is set to the background.
# Debugging Tools
Debugging tools are divided into 7 functional modules: Wxml, Console, Sources, Network, Appdata, Storage, Sensor, Trace
# Wxml panel
WXMLPanel is used to help developers develop WXML converted interfaces. Here you can see the real page structure and the Wxss attributes corresponding to the structure, and you can see changes in the simulator in real time by modifying the corresponding WxsS attributes (for real-time preview only, not to a file). The selector in the upper-left corner of the debug module also lets you quickly locate the WXML code corresponding to the component in the page.
# Sources panel
The Weixin Mini Program framework compiles the script file for the current project.So the files the developer sees in Sourcespanel are processed script files, the developer's code is wrapped up in the define function, and for Page code, there is an active call to require at the end.
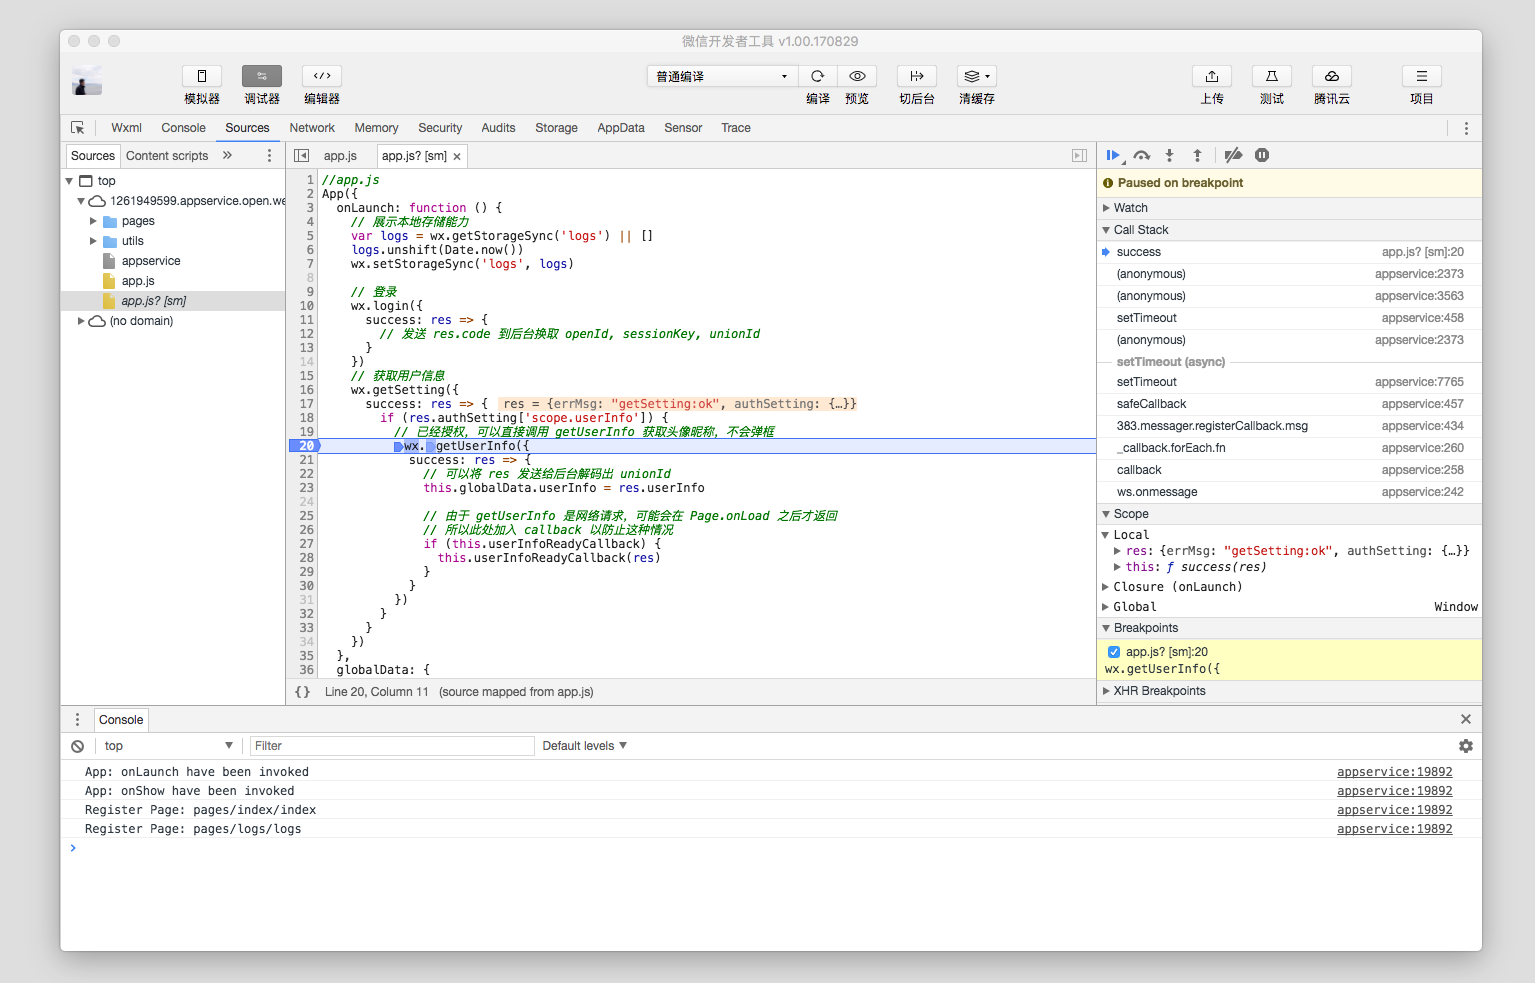
Note: When the code runs to a breakpoint, the whole Weixin Mini Program stops, so the emulator will get a white screen or not work
# AppData panel
AppData panel is used to display the current project runtime AppData specific data, real-time reflection of the project data, you can edit the data here, and timely feedback to the interface.
# Storage panel
The Storage panel displays data storage for the current project after wx.setStorage or wxD.setStorageSync .
You can delete, add, modify data directly on the Storage panel (press delete key)
# Network panel
The Network Panel is used to observe and display requests and sockets
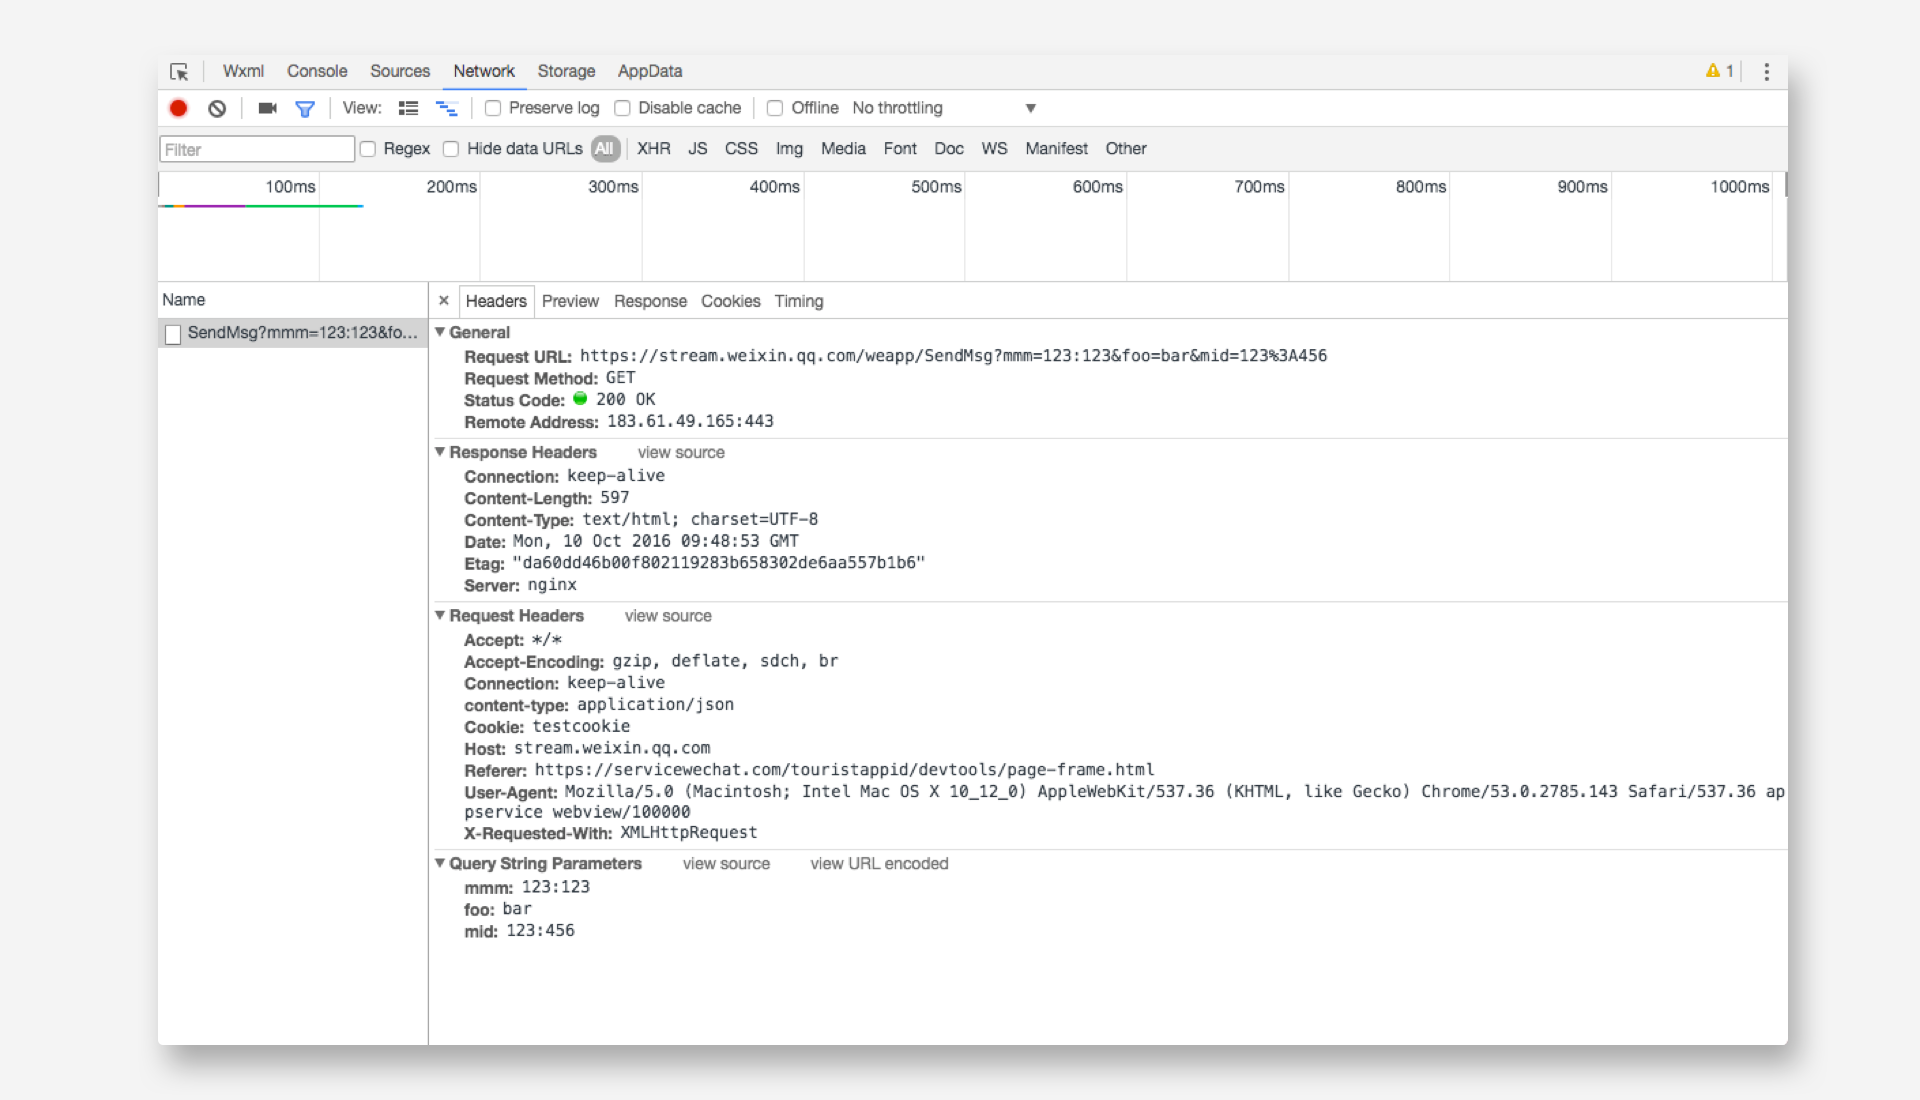
Note: uploadFile and downloadFile are temporarily not supported to view in the Network Panel
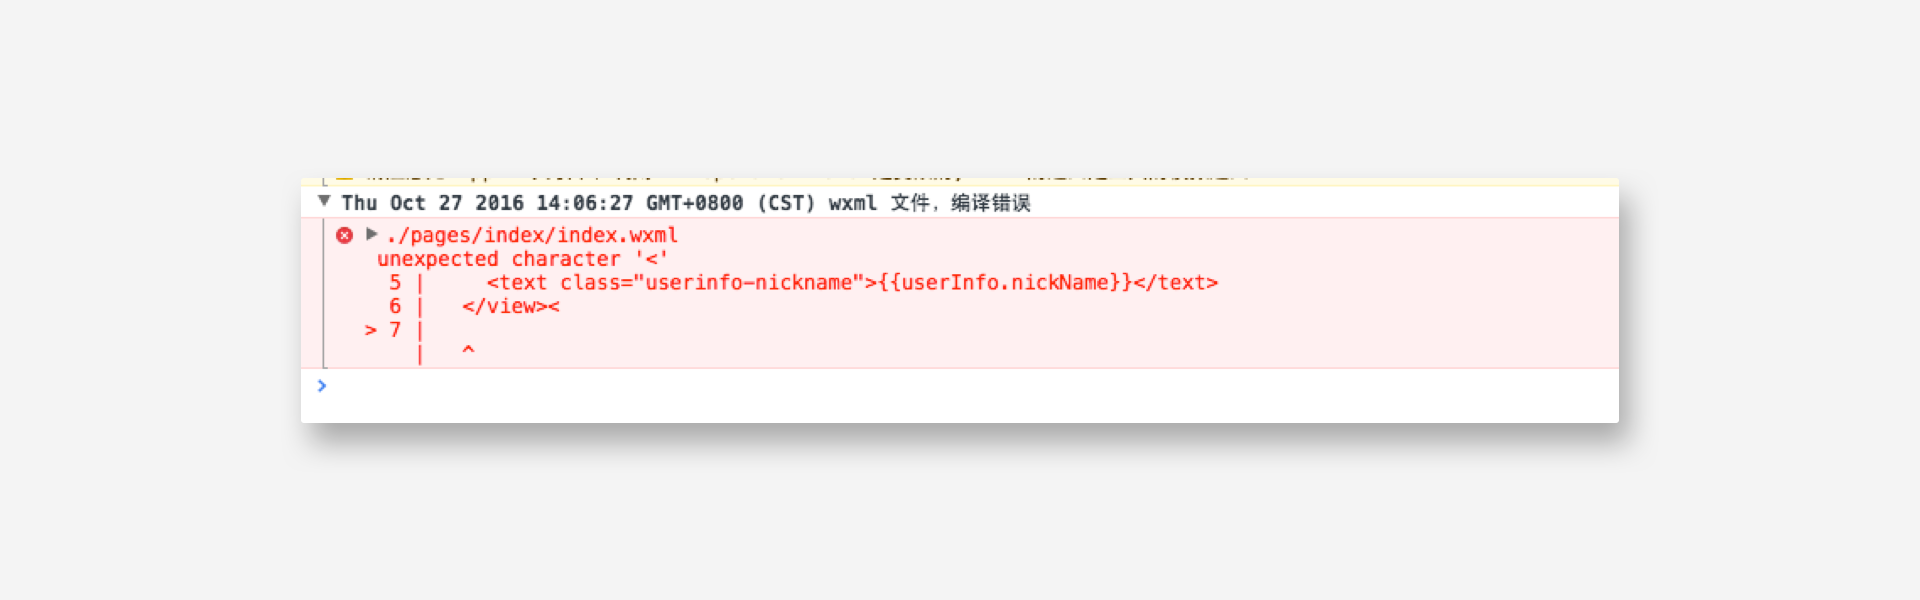
# Console panel
The console panel has two main functions:
Developers can enter and debug code here
The error output of Weixin Mini Program will be displayed here
In the console you can enter the following command
Build: Weixin Mini Program
Preview: preview
Upload: Upload Code
OpenVendor: Open the directory where the base library is located
OpenToolsLog: Open the tool log directory
CheckProxy (url): Checks proxy usage for the specified url
# Sensor panel
The sensor panel has two main functions:
Developers can choose a simulated geolocation here
Development can simulate mobile device performance here, for debugging gravity sensing API
# Automatic preview
Automatic preview can achieve a quick preview when writing Weixin Mini Program, eliminating the trouble of scanning the code or using the Mini Program assistant every time you view the effect of the Mini Program. Just press the shortcut key to keep WeChat running in the foreground to automatically call out or refresh Mini Programs. For PC / Mac WeChat unable to use the scanning function, you can also use automatic preview debugging.
To use the automatic preview feature, you need to work with the WeChat Guest version 6.6.7 and above.
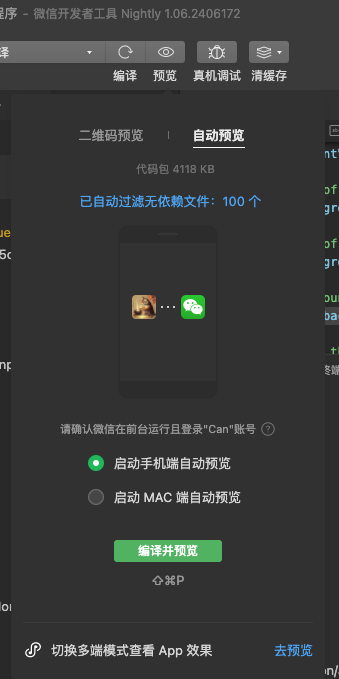
To start using the Auto Preview feature, click the Auto preview tab when you open the preview QR code to switch to Auto Preview mode. Once you have switched to auto-preview mode, simply press the preview shortcut key or click the "Compile and Preview" button on the float to activate the auto-preview.The tool uploads code, and the WeChat guest that keeps the foreground running automatically refreshes the currently developed Weixin Mini Program.
When the automatic preview is successful, the preview icon on the toolbar appears as a green tick. If the preview goes awry, it will appear as a red exclamation mark, which you can click to see the details.
Note that the automatic preview feature is only available on the same account WeChat as logged in to the developer tools.To switch back to the normal preview mode, just click on the "scan QR code for preview" tab.
You can customize the preview shortcut key in Shortcut Settings. The default is cmd (ctrl) + shift + P