# interface
# Launch page
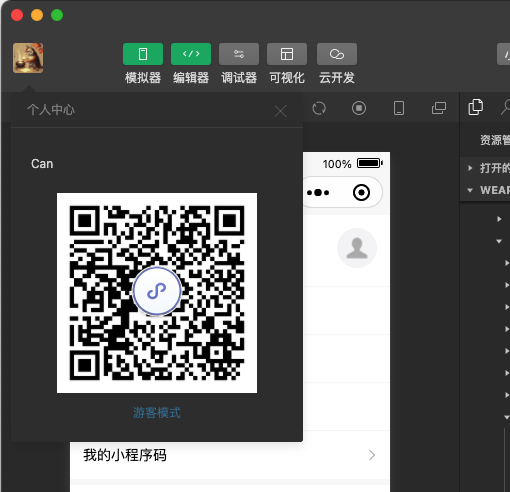
# Login page
On the login page, you can use WeChat to scan the code to log in to the developer tools. The developer tools will use the information from this WeChat account for Weixin Mini Program development and debugging.
If there is no WeChat, you can directly click on the visitor mode to enter (visitor mode can only edit local items)

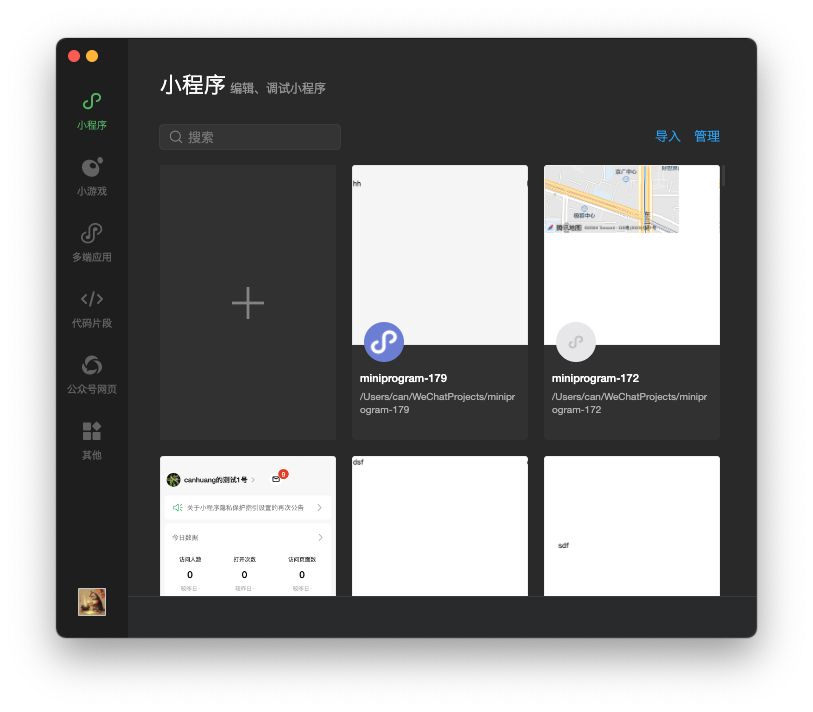
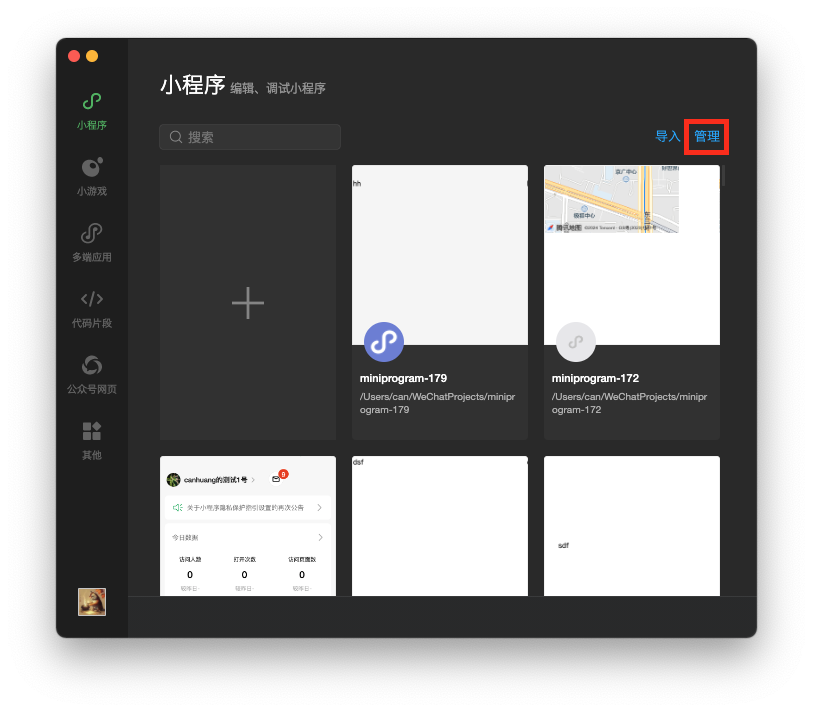
# List of projects
When you sign in successfully, you see a list of existing projects and a list for code snippets.
In the project list you can select Official Account page debugging, enter the Official Account message template debugging mode
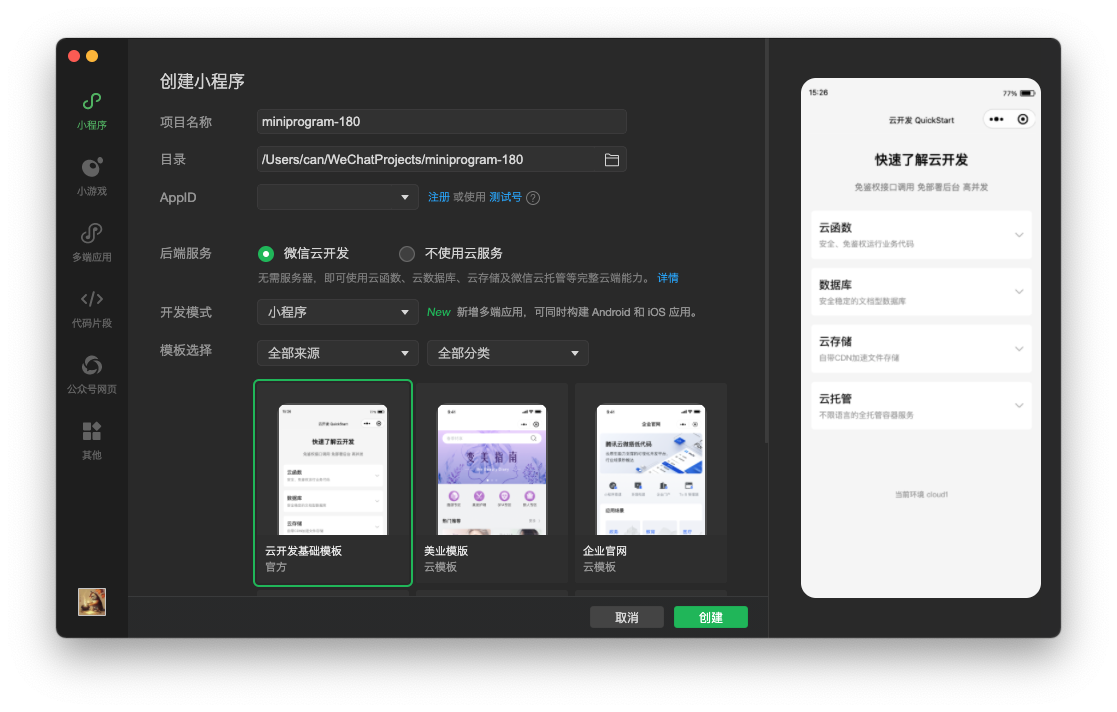
# Newly built projects
A Weixin Mini Program project can be created locally when the following conditions are met
- Need a Weixin Mini Program AppID ;If you do not have an AppID, you may choose to apply for the test number .
- The WeChat login number needs to be the developer of the AppID;
- You need to select an empty directory, or select a non-empty directory where
apagejsonOrproject.config.json.When you select an empty directory, you can choose whether to generate a simple project under that directory. - Developer tools provide a very rich set of modules, and you can also choose a template to create a project.
# Work on more projects
The tool supports opening multiple projects at the same time. Each time a project is opened, it opens from a new window. The entrances are as follows:
- Open projects from the project selection page. When you are in the project window you can open the project selection pages from the items in the menu bar -> View all items
- Items opened from the list of recently opened items in the menu bar are opened from a new window
- Newly built projects
- Command line or HTTP invocation tool to open the project
# Managing projects
Delete and bulk delete local items
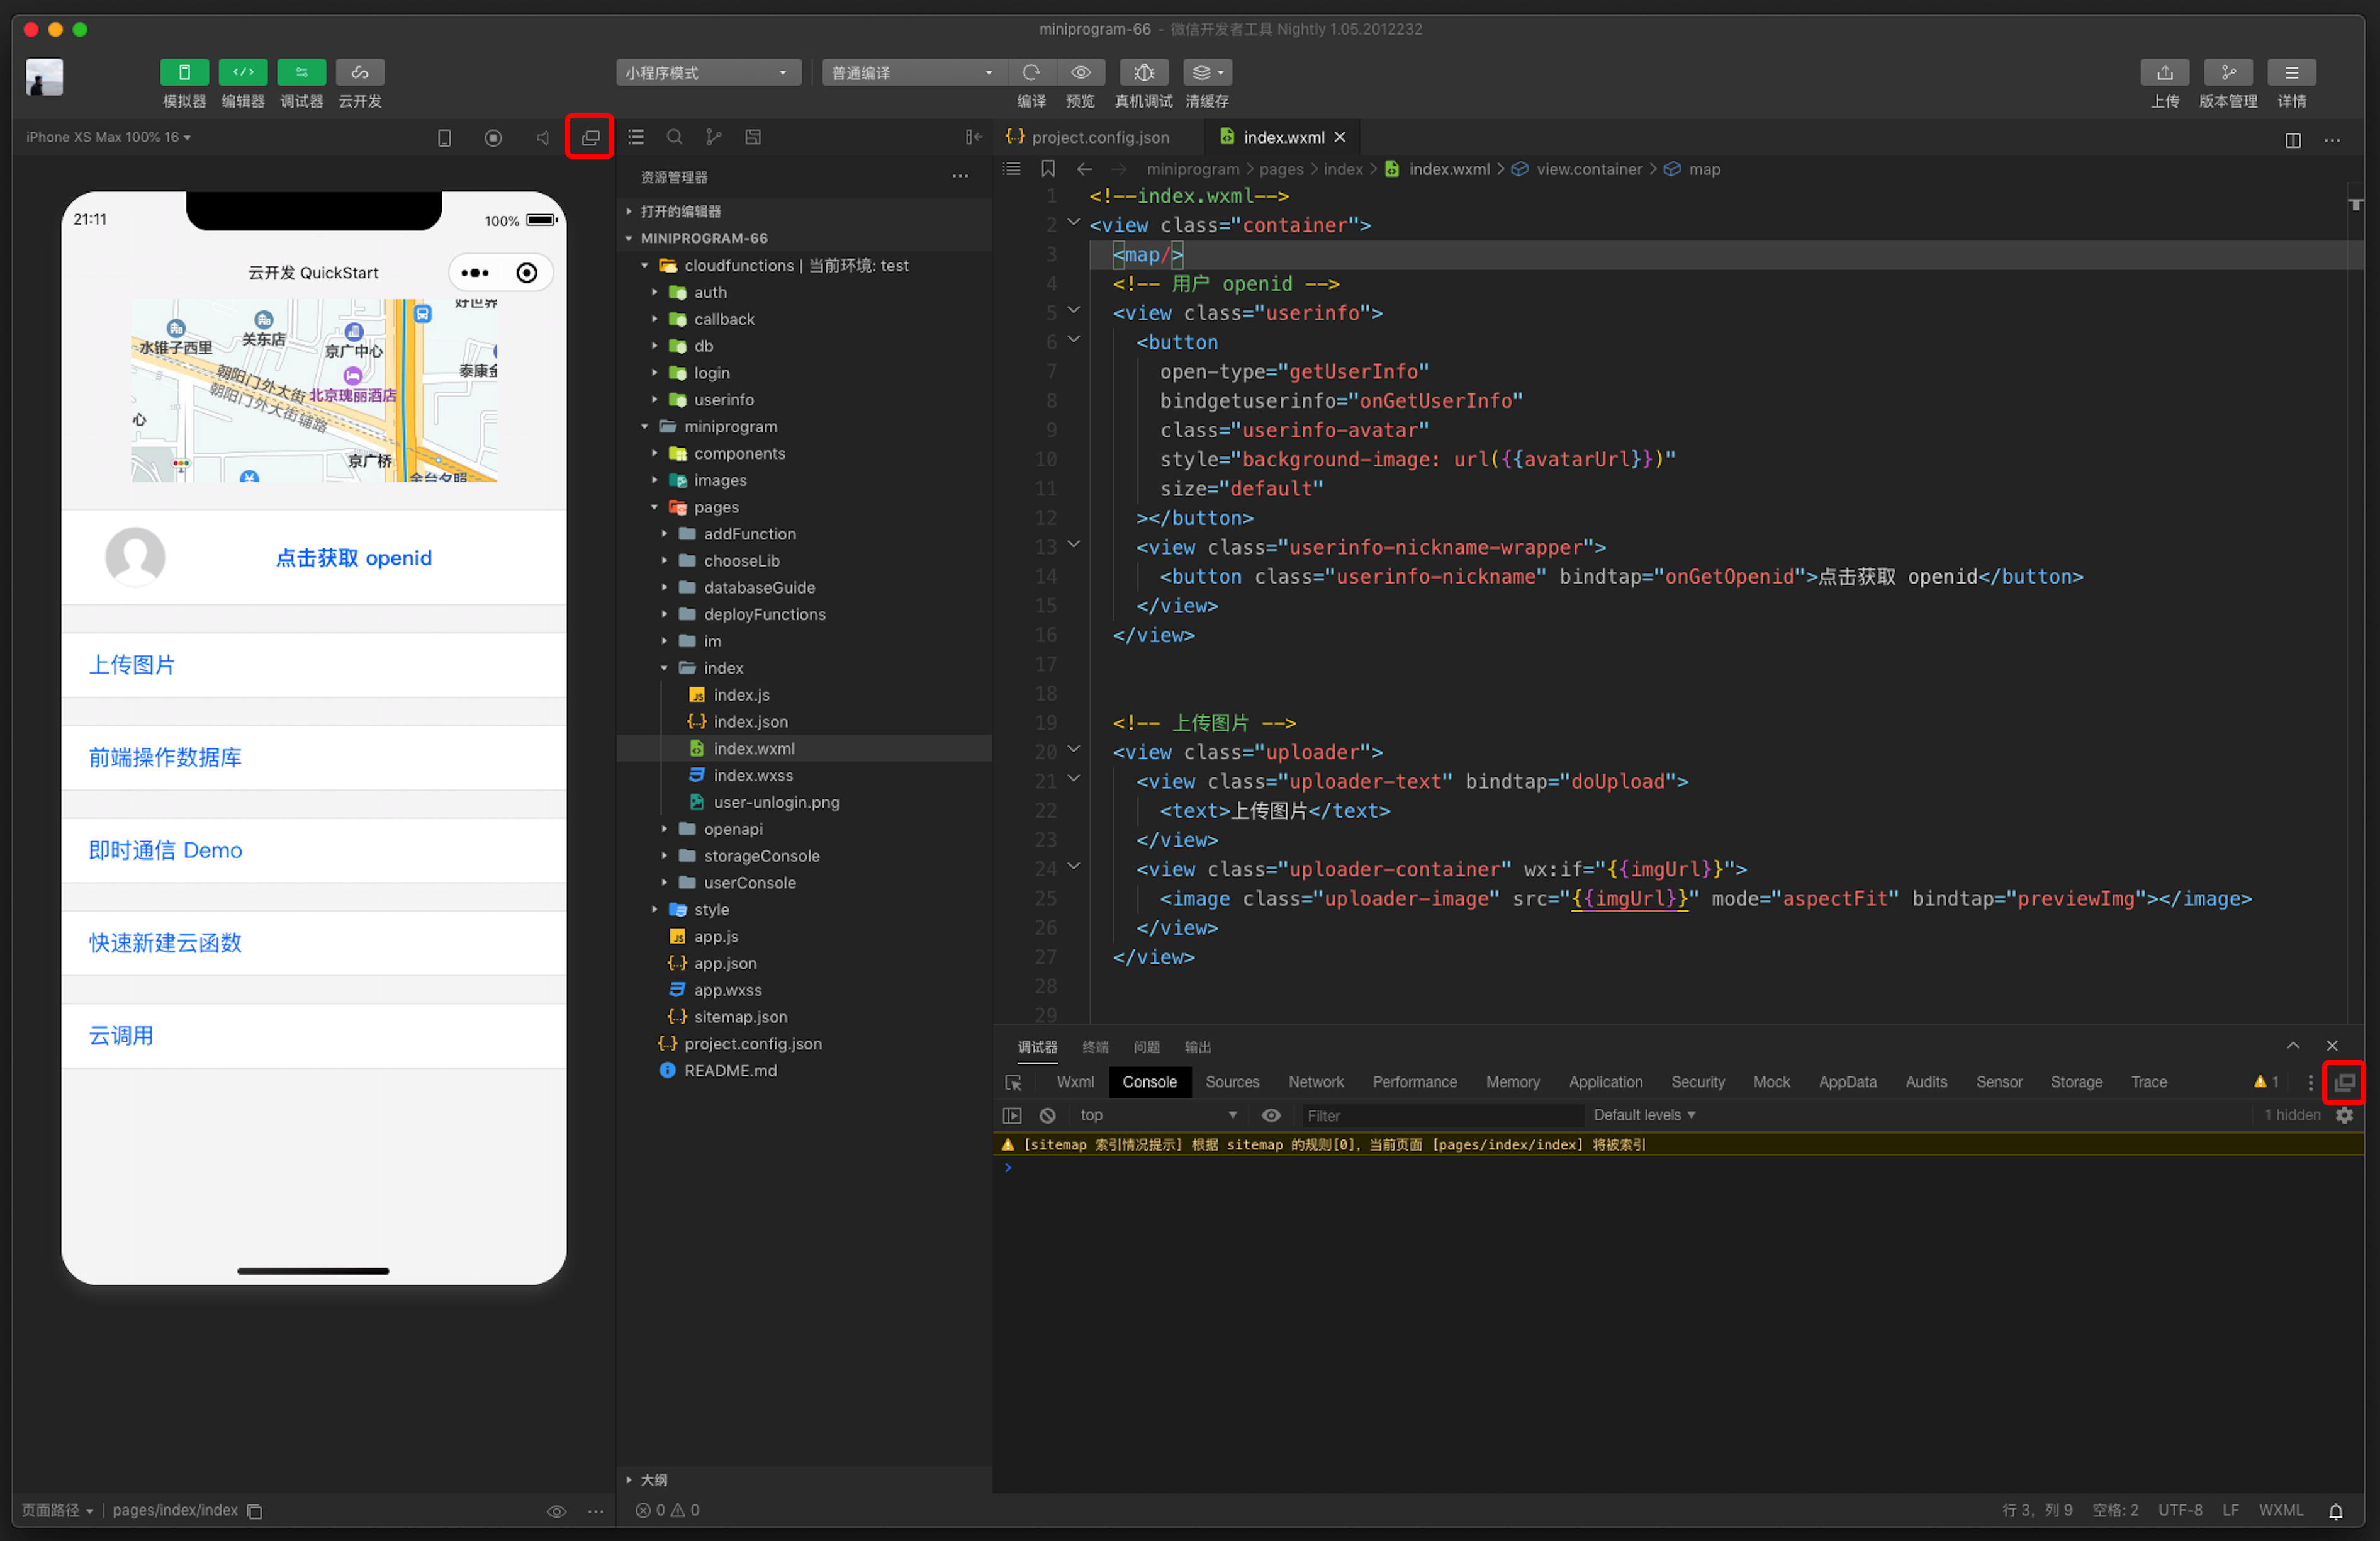
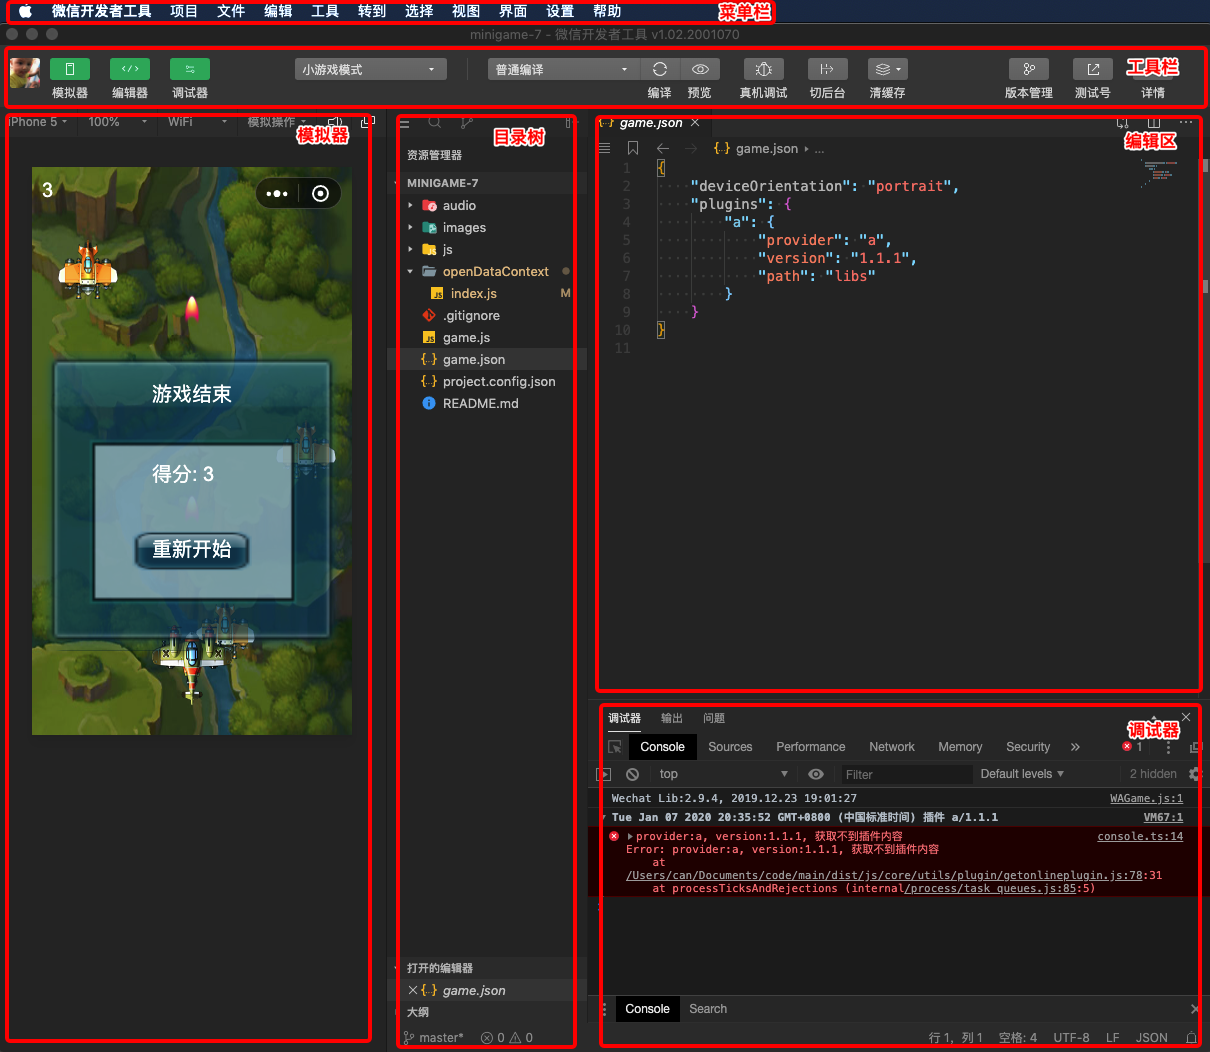
# The main interface
The developer tools main interface, from top to bottom and left to right, is comprised of six major components: menu bar, toolbar, emulator, directory tree, editor area, and debugger.
# menu bar
WeChat Developer Tools
Switch Accounts: Quickly Switch Login Users
About: About Developer Tools
Check for Updates: Check for Version Updates
Developer Forum: Go to the Developer Forum
Developer documentation: go to developer documentation
Debugging: Debugging developer tools, debugging editors; If you encounter a suspected developer tool or compiler bug, you can open the debugging tool to see if there is an error log, welcome feedback on the forum
Change development mode: Quickly switch between Official Account web debugging and Weixin Mini Program debugging
Exit: Exit Developer Tools
project
New Projects: Quick New Projects
Open recently: You can view a list of recently opened items and choose whether to go to the corresponding item
View all projects: New window opens the project list page of the startup page
Close the current project: Close the current item and go back to the project list page on the startup page
file
New file
save
Save all of them
Close the file
Edit: You can view edit-related actions and shortcut keys
tool
Compile: Compile the current Weixin Mini Program project
Refresh: Consistent with the compiled feature, keeping the corresponding shortcut key ctrl () + R for historical reasons
Compilation configuration: You can choose either normal compilation or custom compilation conditions
Front-background switching: simulate the operation of the guest Weixin Mini Program entering the background and returning to the foreground
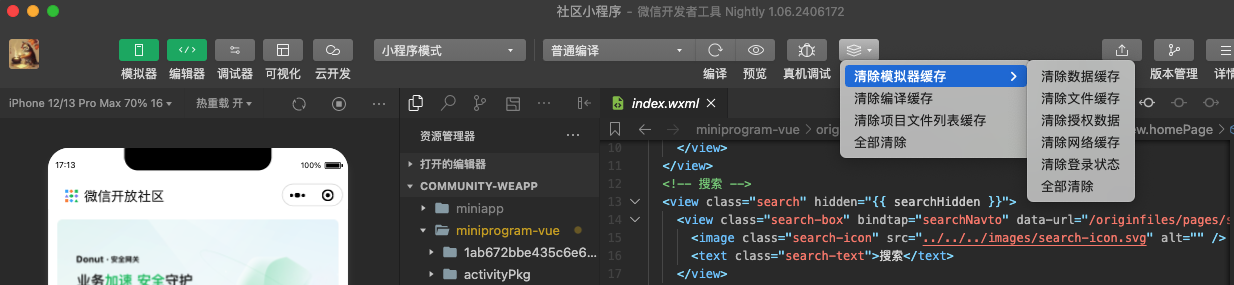
Clear the cache: Clear the file cache, data cache, and authorized data
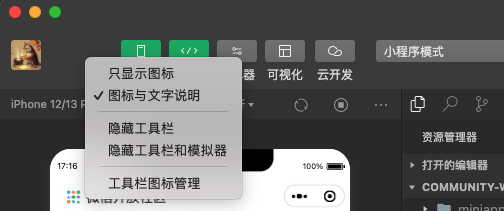
Interface: Control the display and hidden of the main interface window modules
Settings:
STYLE SETTING: Control the editor's color theme, font, font size, line spacing
Editing settings: Controlling the behavior of file saving, how the editor behaves
Proxy Settings: Select Direct Network, System Proxy, and Manually Set Proxy
Notification Settings: Set whether to accept a certain type of notification
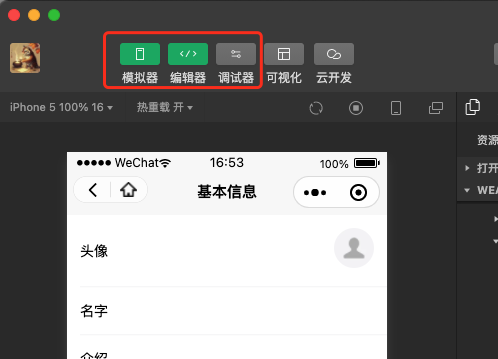
# toolbar
Clicking on the user profile makes it easy to switch users.
To the right of the user profile is a button that controls the display / hidden of the main interface module. At least one module needs to be displayed.
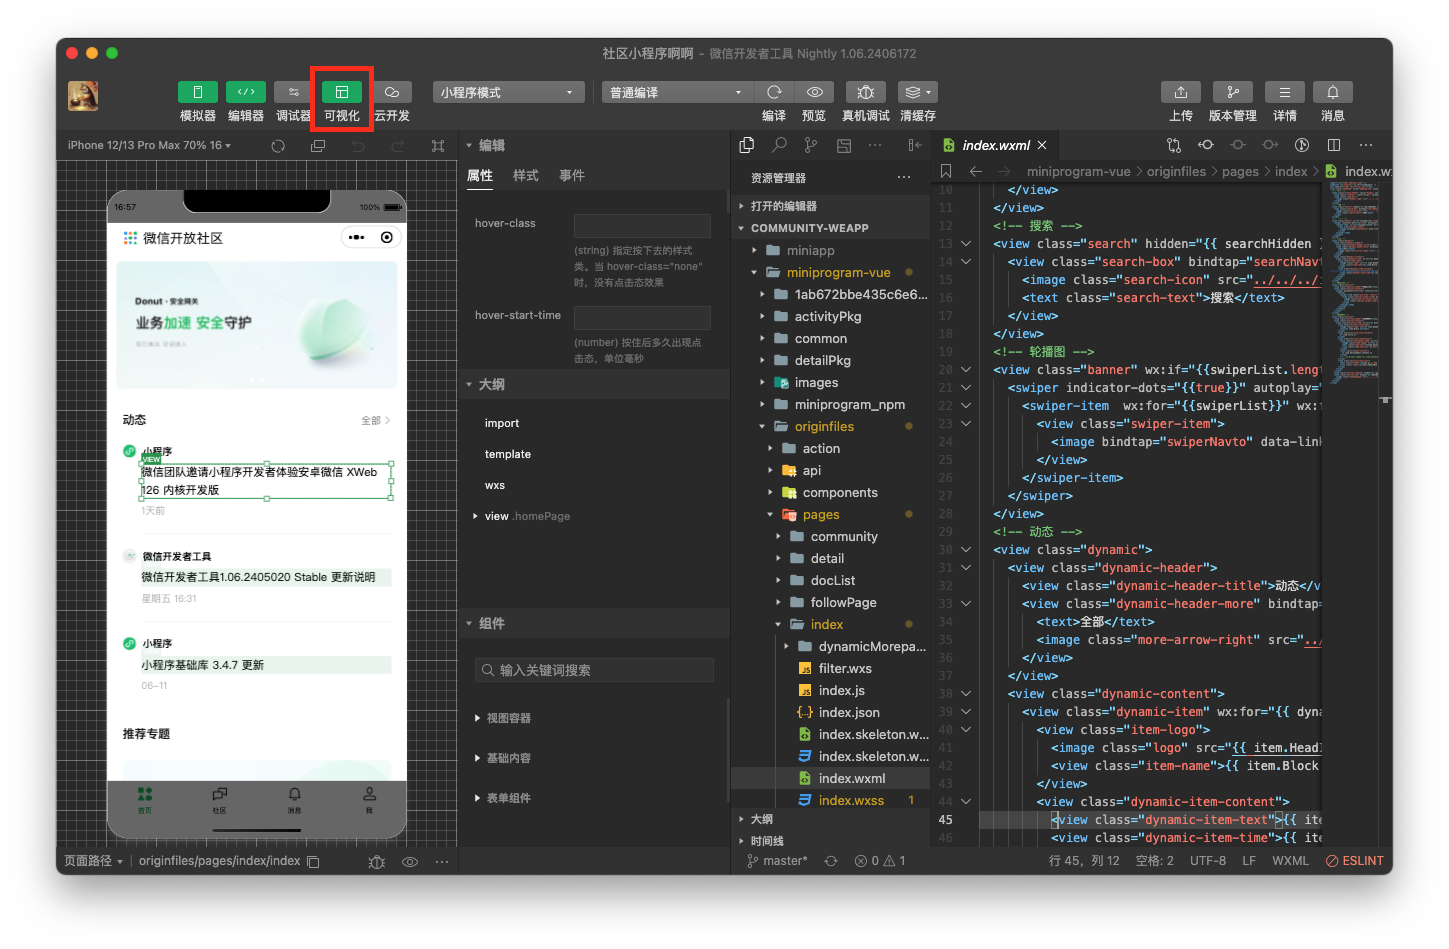
You can enter visually assisted programming mode by using the "visualize" button
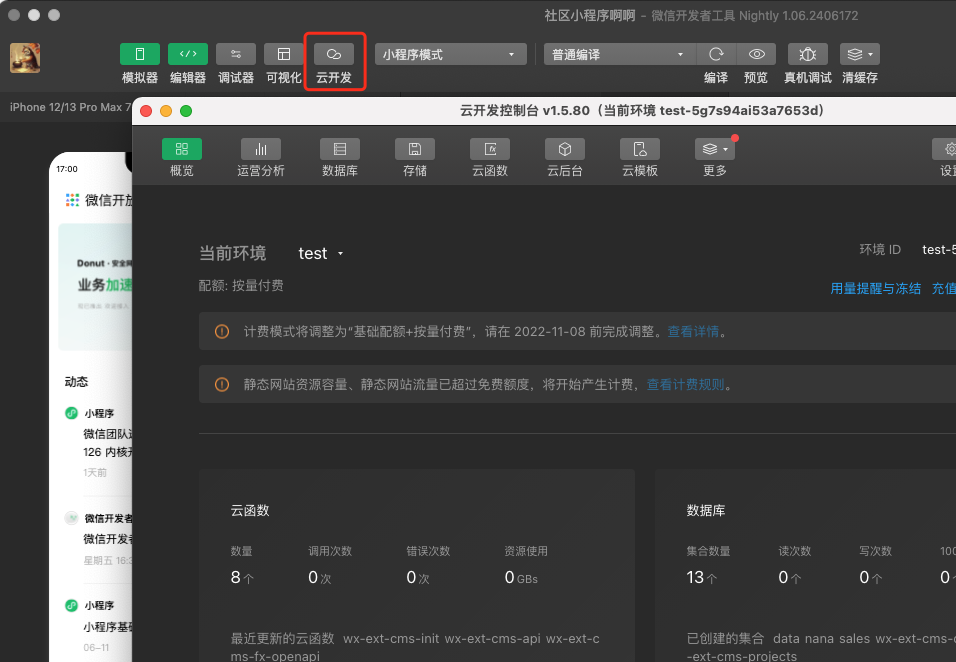
Through the cloud development button, you can open the cloud development console and manage the corresponding cloud development resources.
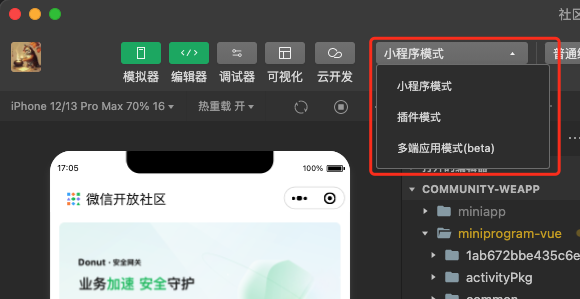
In the middle of the toolbar, you can switch to plug-in mode (for developing Weixin Mini Program plug-ins), Multi-platform App mode (Used to generate Weixin Mini Program for iOS / Android Mobile App)
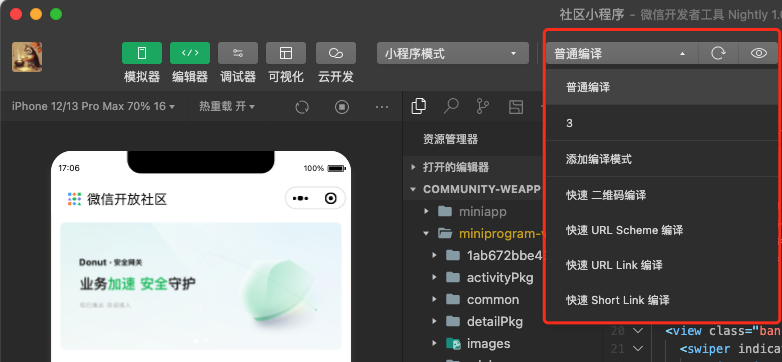
In the middle of the toolbar, you can choose ordinary compilation, you can also create and select custom conditions for compilation and preview, you can use the ](../OpenApiDoc/qrcode-link/qr-code/getQRCode.md) 、 URL Schema 、 URL Link 、 Short Link Do a quick compilation and preview
The toolbar provides a quick entrance to clear the cache.Can be convenient to remove the file cache on the tool, data cache, WeChat guest corresponding to Weixin Mini Program login status, authorization status, convenient developers debugging
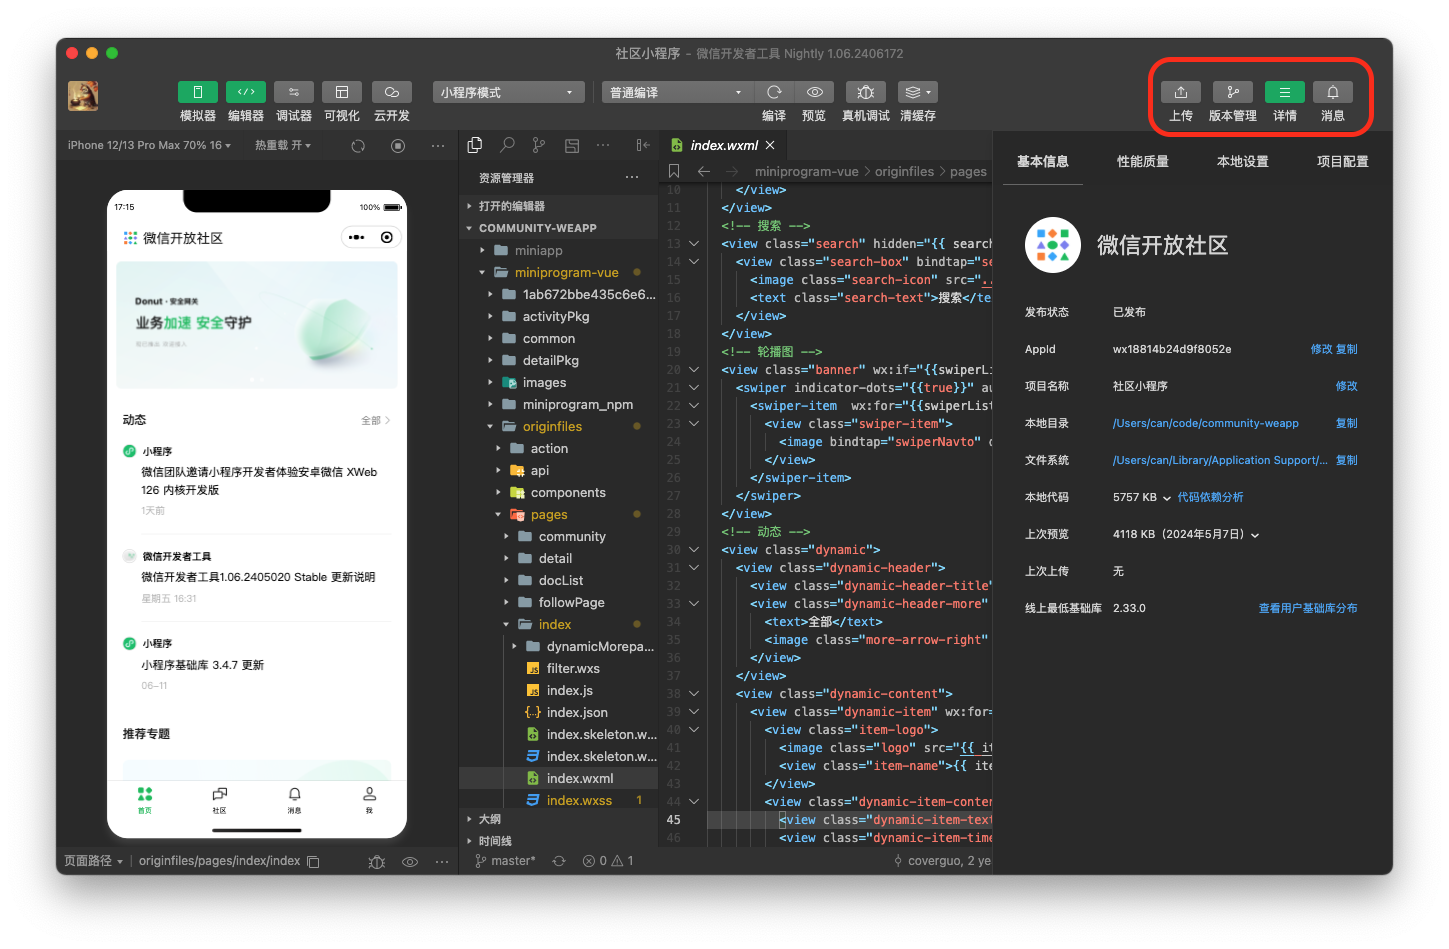
The right-hand side of the toolbar is the area for development assistance, where you can upload code, version management, and view project details
# Toolbar Management
Click the right mouse button on the toolbar to open toolbar management
# simulator
The analog device can simulate the behavior of Weixin Mini Program on WeChat. The code of the Mini Program can be run directly on the emulator after compilation.
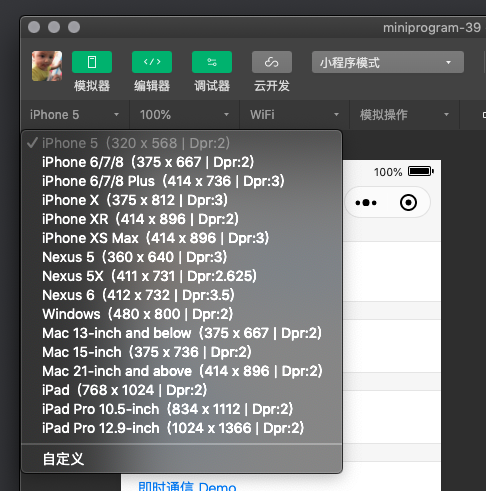
Developers can select different devices or add custom devices to debug Weixin Mini Program on different sizes.
At the bottom of the emulator, you can visually see the current running Weixin Mini Program of the scene value, page path and page parameters
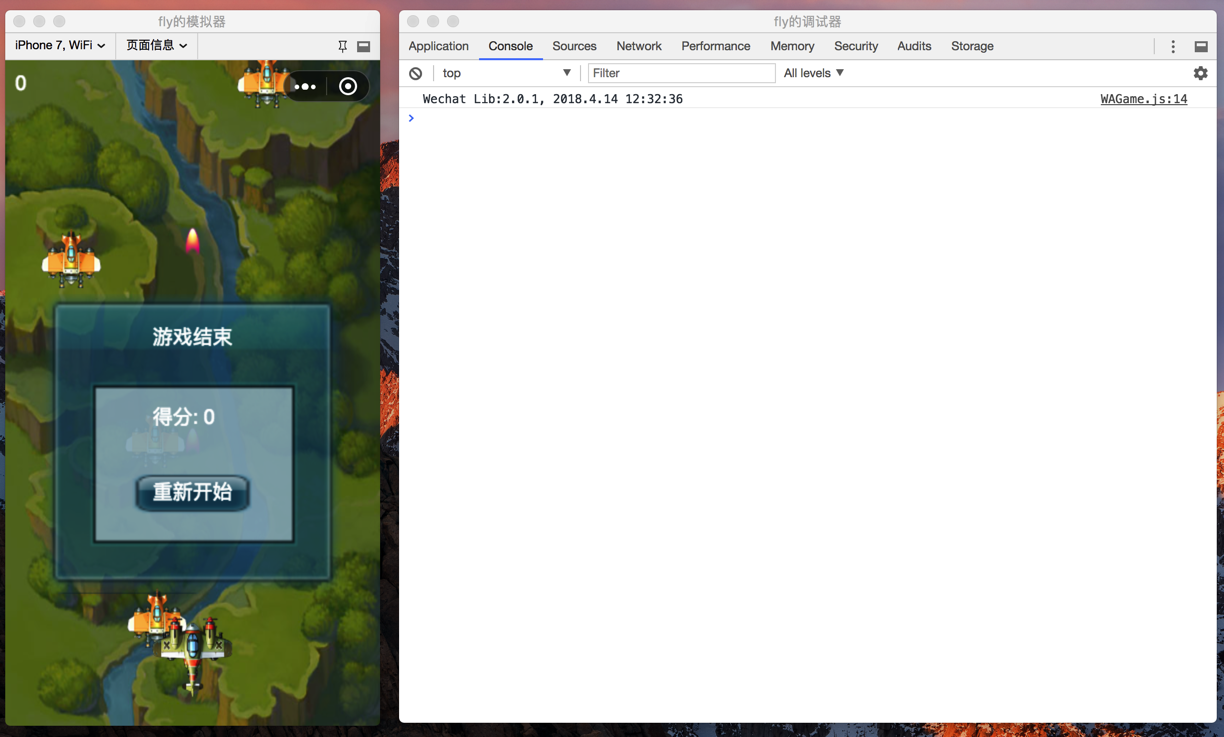
# Separate windows
Click Emulator / Debugger The button in the upper right corner can display Emulator - Debugger using a standalone window