The WeChat developer tool is an simulation of the WeChat-]] client, limited by differences between desktop and mobile devices, and some unique data of WeChat, while some APIs differ between the tool and WeChat in view of development convenience.
# The barcode interface
Unlike calling Genentown to scan code directly on the mobile phone, calling Genentown to scan code on the PC or Mac is an inefficient behavior. So after calling the QR code scanning API on the development tool, the developer can select a local image for subsequent logical debugging, rather than actually enable the camera to scan the code. The process is different, but the input and output of the interface are consistent.
# WeChat Payment
The latest version of the developer tool already supports WeChat payment debugging, but for security reasons, it is different from calling Weixin Pay directly from your phone:
- Developers with new bindings need 24 hours before they have permission to debug paid for WeChat
- When a developer calls the WeChat payment API on the tool, a QR code appears in the tool, and the developer must scan the code on the phone after completing the payment process using the WeChat account currently used in the development.
- The tool will synchronize the mobile terminal WeChat payment back to the package to the tool, the developer to carry out follow-up operations
The interactions used vary, but the input and output tools of the interface are consistent with those of the client.
# Start using custom parameters
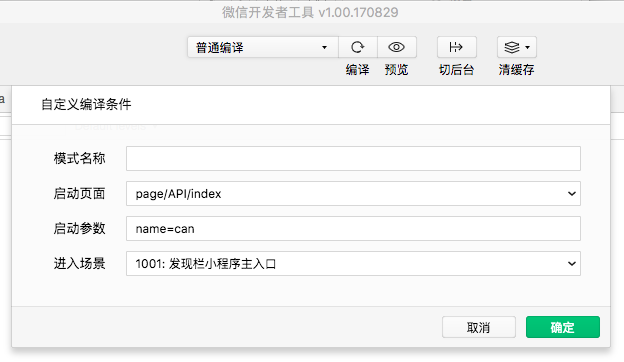
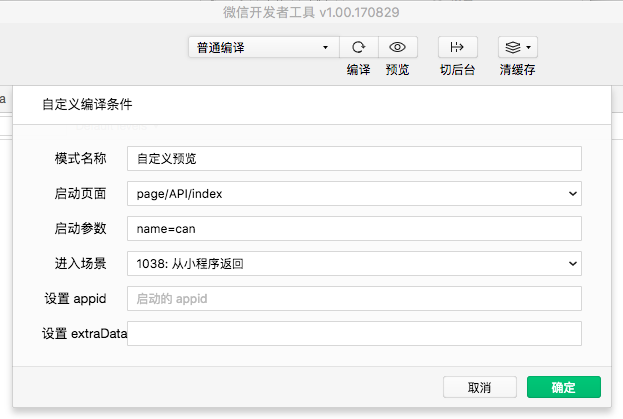
In daily use, users can scan the code, share open a Weixin Mini ProgramThis will be based on the set launch page:pathJump to the corresponding Mini Program page (not necessarily the home page) and can carry parameters:`` query`。In the developer tools, developers can also debug different startup pages and startup parameters by customizing compilation conditions.
For example, the following figure is to select the entry page ispage / API / index, and the parameter isname = can
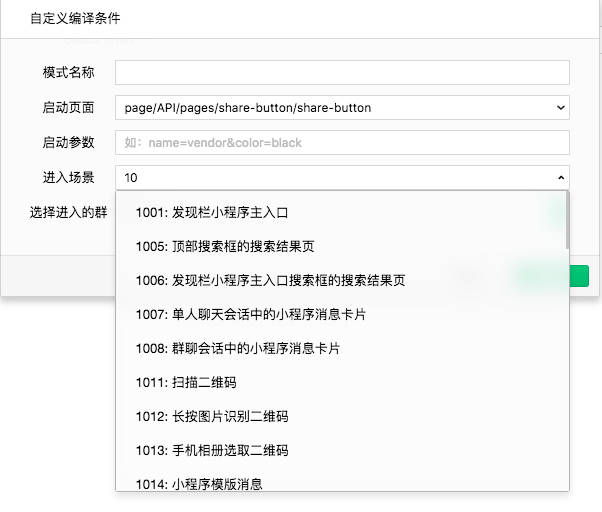
# Enter scenario values
In the WeChat client, users may open Weixin Mini Program details in various scenarios, but there is no real environment in the developer tools to simulate these scenarios.Developers can use conditional compilation to debug different scenarios.
# Ordinary retweets
The call forwarding on the developer tool is a simulated behavior, and it will not be forwarded to the user, and the developer can determine whether the correct call of the forwarding API is based on this simulated behavior.
# Replication of group information
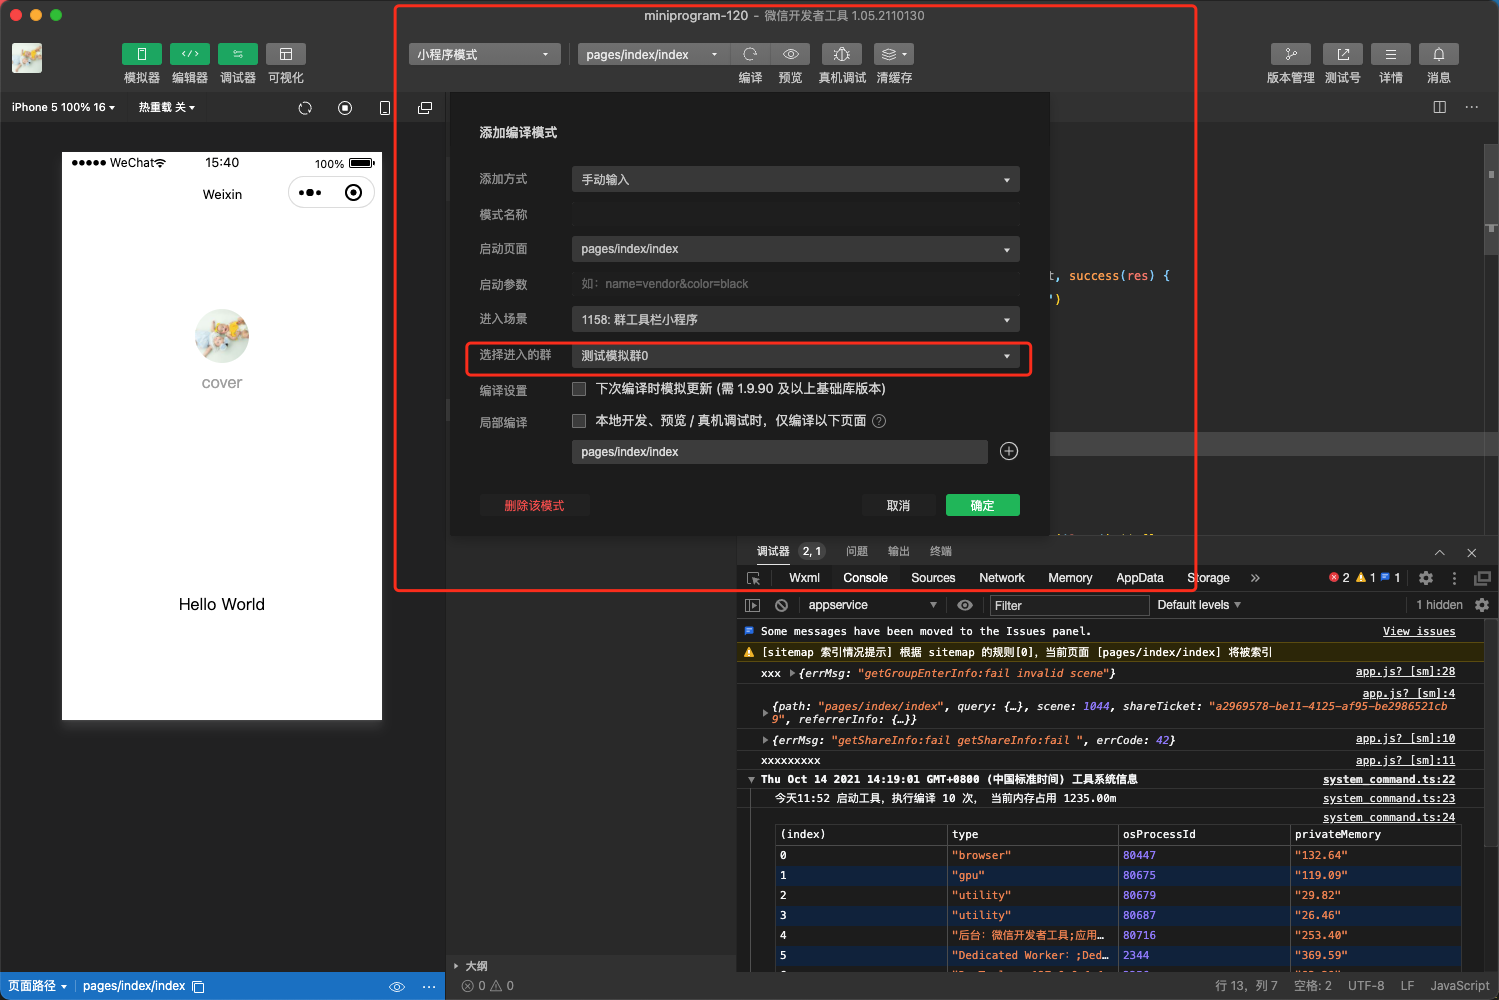
Debugging wx.getGroupEnterInfo in Developer Tools The interface needs to set the current Weixin Mini Program scene value to be a group chat scene, such as1158 The group tool opens the Mini Programscene value.
You can add a compilation mode in the developer tool, set the entered scenario value to a group chat scenario value such as 1158, and select the groups to simulate entering.Use this pattern to load into Weixin Mini Program and debug the call to wx.getGroupEnterInfo interface.
# sample code
wx.getGroupEnterInfo({
  success: (result) => {
    console.log('success', result)
  },
  fail: (result) => {
    console.log('fail', result)
  },
})
# Forwarding with shareTicket
Forwarding withshareTicketcan get more forwarding information, such as the name of the group chat and the group IDopenGId。On the Weixin Mini Program developer tool, developers can debug forwarding withshareTicketin the following ways.
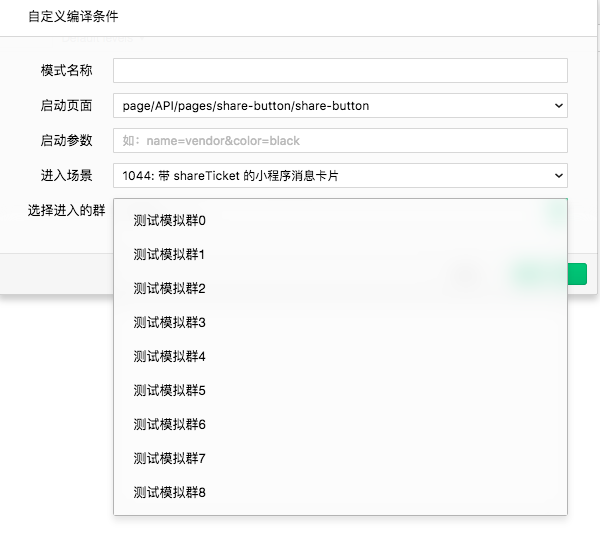
Call wx.showShareMenu The parameterwithShareTicketistrueWhen you click the forward button that appears after the upper-right menu of the simulator, a list of test groups appears, as shown in the diagram:
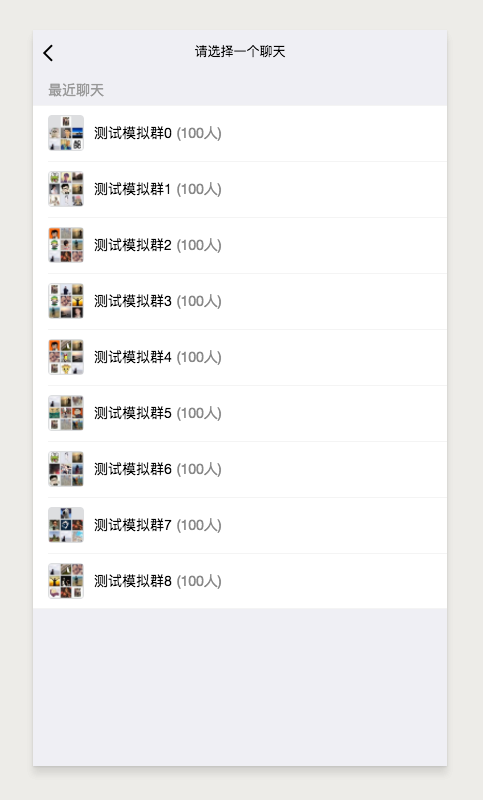
Developers click to select any group, through the interface of the packet back to getshareTicket,By calling wx.getShareInfo you can get the information about the forwarding
When a developer needs to debug from a group point, and withshareTicketIn ascenario, you can usein your custom compilation 1044: Weixin Mini Program message cards (with shareTicket) in a group chat sessionYou can also select any simulated test group, as shown in the diagram
# Preview using custom compiling conditions
As with startup using custom parameters , when submitting a preview, developers can customize the preview to debug different startup pages and startup parameters on mobile devices.We can preview the custom compilation conditions that have already been created.
# Jump Weixin Mini Program Debugging support
Weixin Mini Program Jump Development and debugging can be divided into two parts
# Debugging whether Weixin Mini Program can jump correctly
Call wx.navigateToMiniProgram on the tool for the security of Weixin Mini Program codeAt this time, the developer tool does not actually open and jump to another Mini Program, but the tool judges the binding relationship between the Mini Program currently and the Mini Program that needs to be jumped, and outputs relevant information to the developer. Developers can determine whether the call was successful based on the callback function that was successful or failed.
# Debugging the correct reception parameters when Weixin Mini Program is turned on
Select Custom Compile to enter the scene selection 1037 From Weixin Mini Program to you can debug whether the Mini Program received the correct parameters when it was opened and did the relevant processing.

Select Customize Compile Go into the scene Select 1038 Return from Weixin Mini Program You can debug whether the Mini Program received the correct parameters and processed them when it returned.
# Weixin Mini Program Link-related debugging
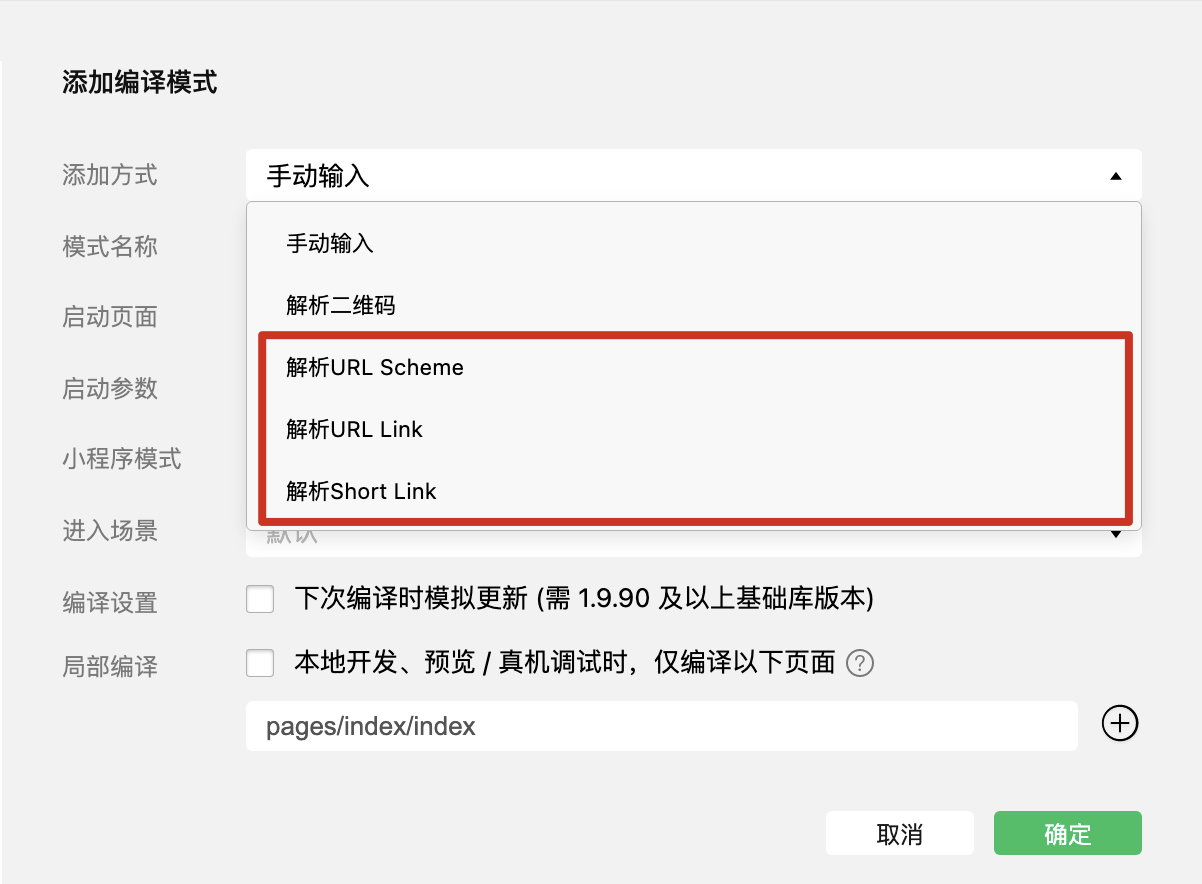
Weixin Mini Program The link contains URL Scheme 、 URL Link 、 Short Link 。To debug when you click on these links to enter a Mini Program or whether the paths and parameters carrying the links themselves are correct, you can debug them as follows.
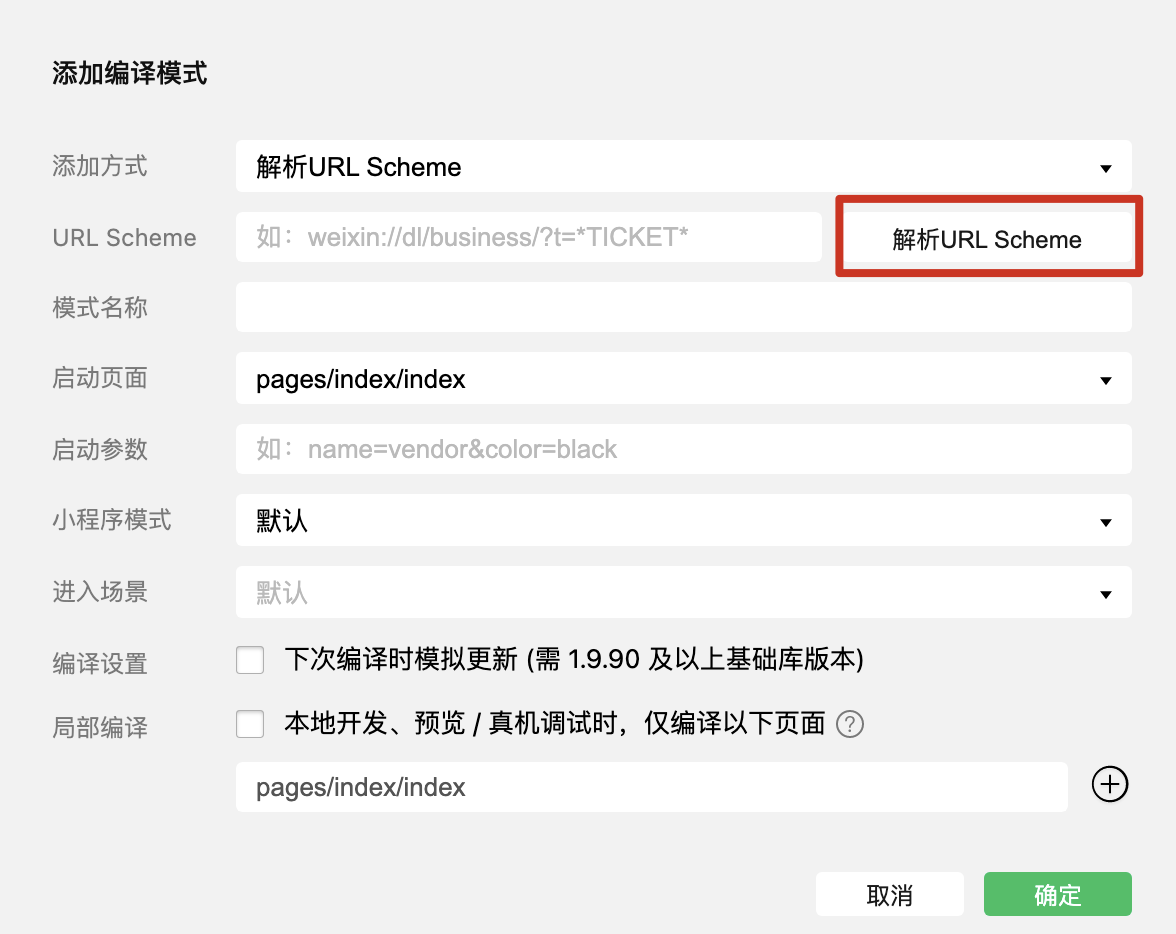
When adding compile mode, you can choose Add mode , you can choose to parse "URL Scheme, "" URL Link, "" Short Link, "or Weixin Mini Program Binary Code
Parsing a specific Weixin Mini Program link can get the specific page path and parameters contained in the link, and also automatically fill in the corresponding scene values for developers to debug. Note that the Mini Program AppID that you fill in the link will need to match the appid Mini Program that you are currently developing and debugging, otherwise it will fail to parse.
# Chat tool debugging
The latest version of the developer tool has supported Liaotiantool debugging, specific way to select Liaotiantool page after selecting Liaotiantool mode
