# Features Overview
The real-world remote debugging feature enables debugging of Weixin Mini Program running on the phone directly using developer tools over a network connection, helping developers better locate and find problems on the phone.
It is recommended to use Real Debugging 2.0 for debugging.
# The debugging process
To initiate a real-world remote debugging process, you first need to click the "Real-world Debugging" button on the developer tools toolbar.
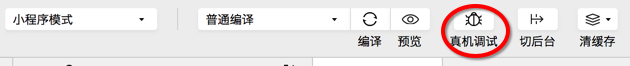
At this time, the tool will process, package and upload the local code, and after it is ready, use the mobile phone to scan the QR code to pop up the debugging window and start remote debugging.
# Remote debugging window
Use your phone to scan this QR code to start remote debugging.
To end debugging, just close this debugging window or click the "End Debugging" button in the lower right corner.
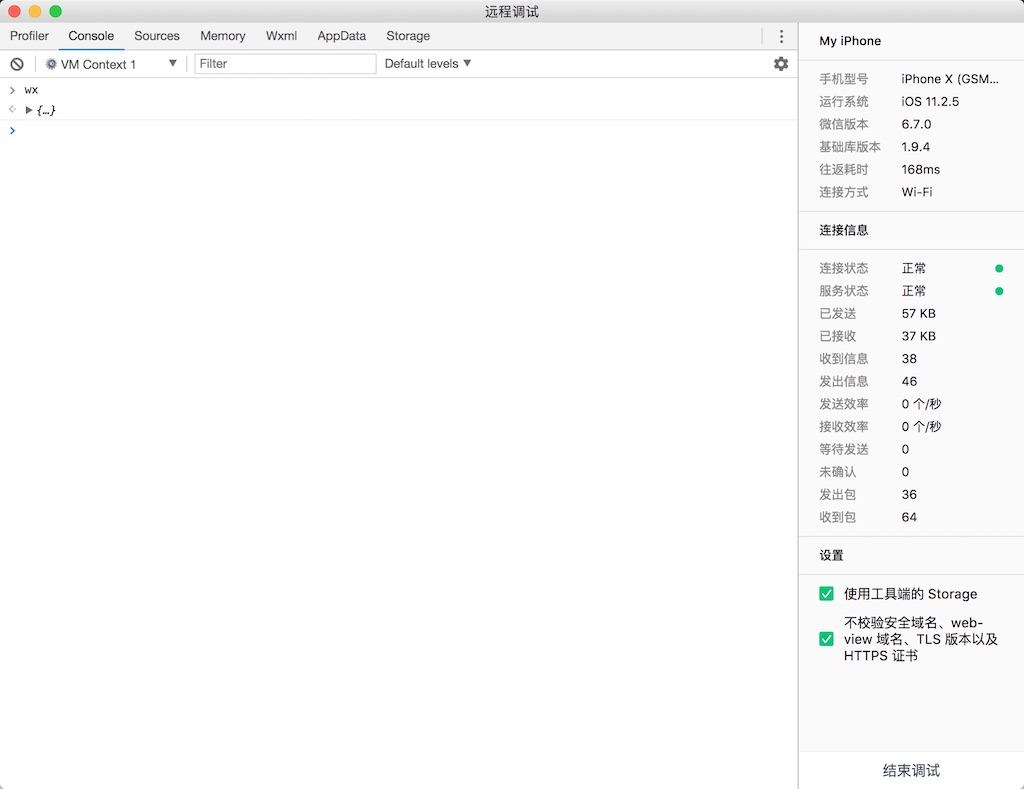
The remote debugging window is divided into two parts, the debugger view on the left and the information view on the right. Developers can debug code directly in the debugger, and view the storage situation; The info view allows you to see the current connections to your phone and server, as well as the error messages that have occurred.
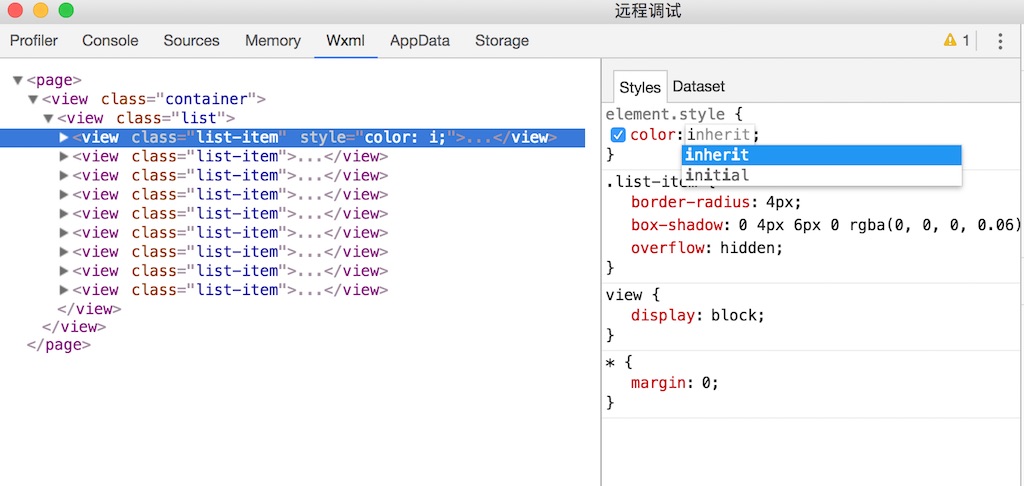
# Debugger
In a remotely debugged debugger, developers can debug code in the Console panel, view the Weixin Mini Program source code in the Sources panel and perform breakdown single-step debugging, and view the storage usage of the Mini Program in the Storage panel.
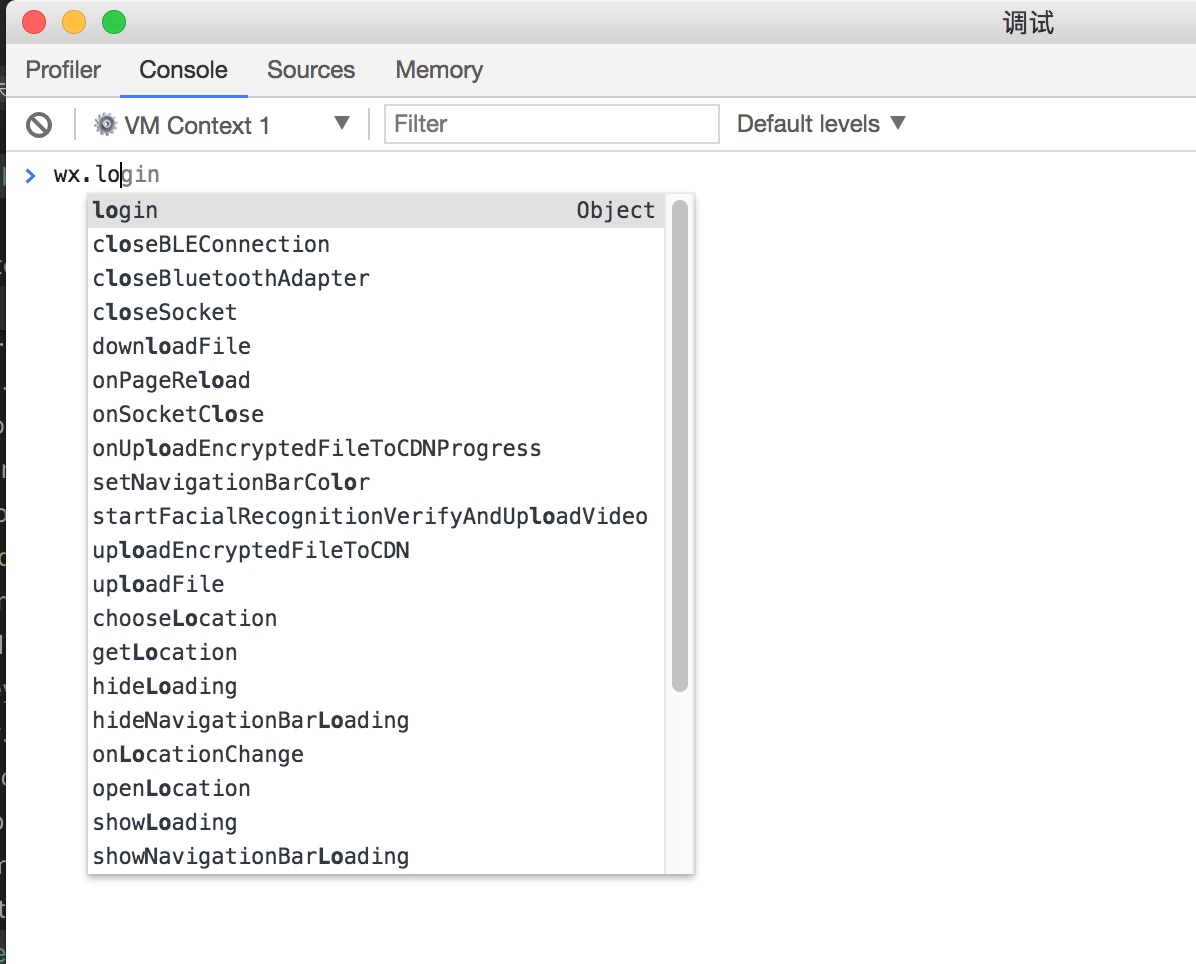
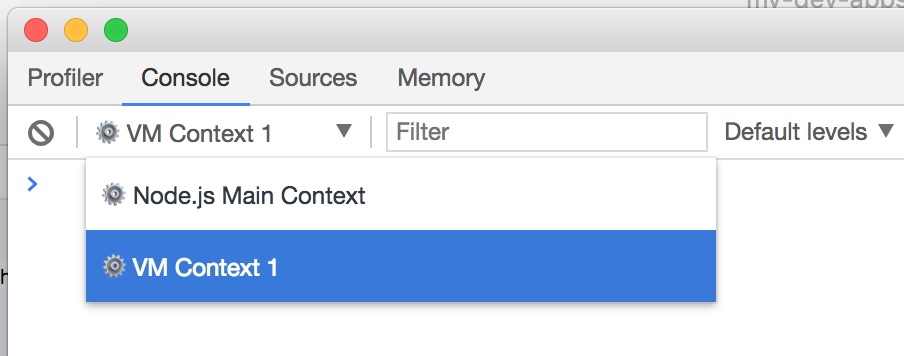
Note that to debug Weixin Mini Program in the Console, you need to switch the debug context to VMContext1, as shown.
When viewing the source code in the Sources panel, all of the developer's file paths start withweapp: / /.
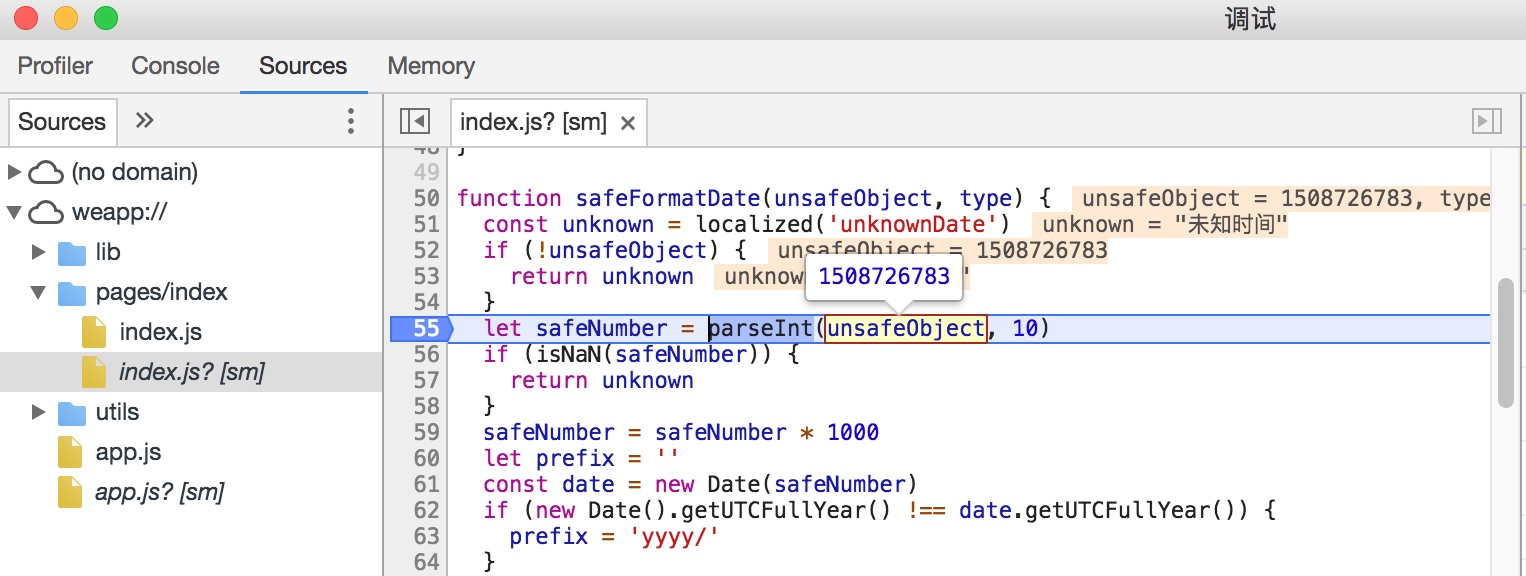
In addition to step-by-step debugging in the debugger, developers can manually insert thedebugger into their code;statement for breakpoint debugging.Therefore, if you want to break the point as early as possible when Weixin Mini Program starts, you can manually insert thedebugger into the code that needs the break point before going into remote debugging;statement.
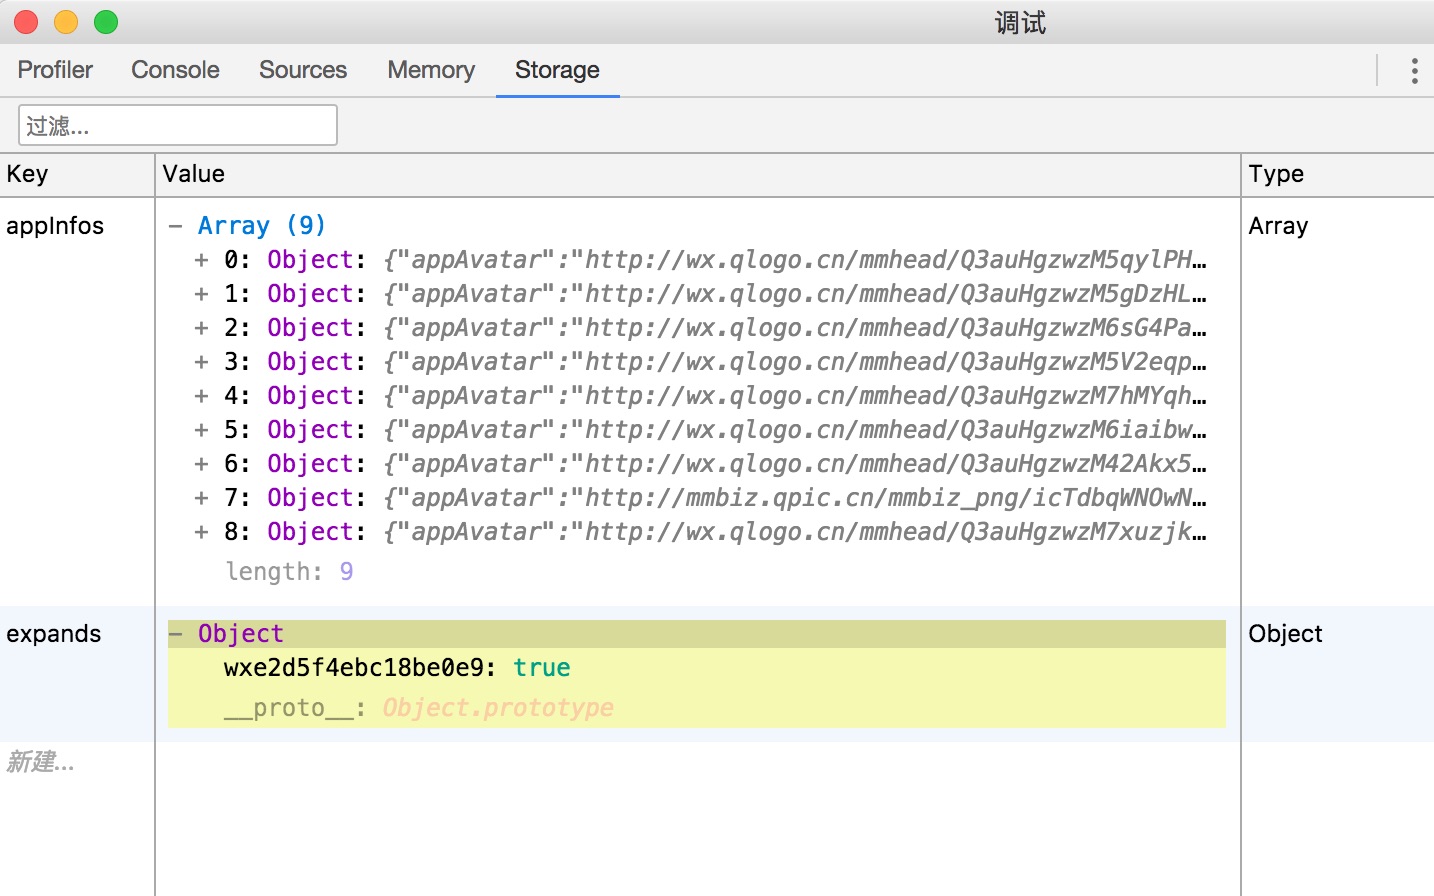
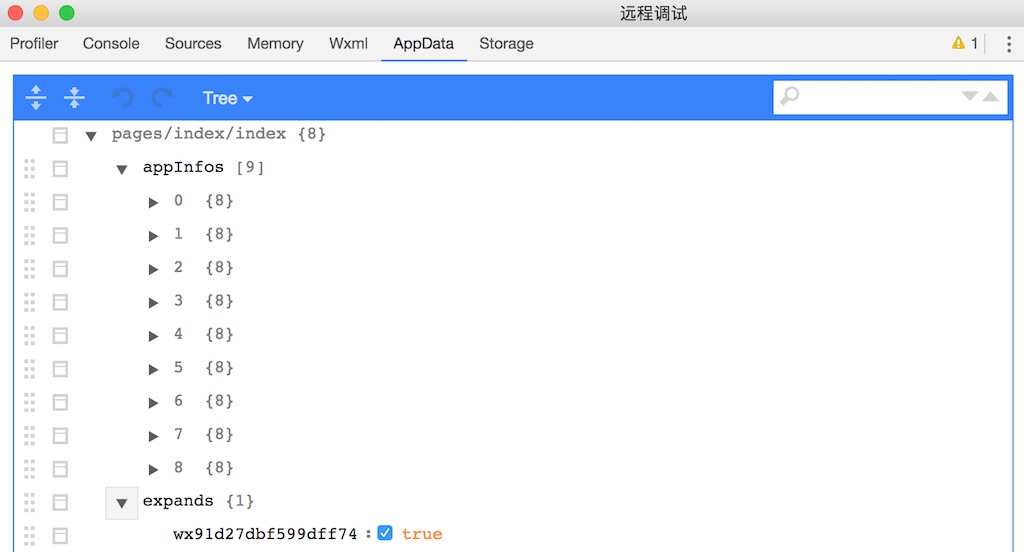
The operation of the WXML, AppData, and Storage panels is consistent with the operation of the developer tools when debugging the emulator. Note that if "Use Storage on the toolside" is unchecked in the right information view, all the storage data will be stored on the phone and the storage panel will no longer appear.
# Information View
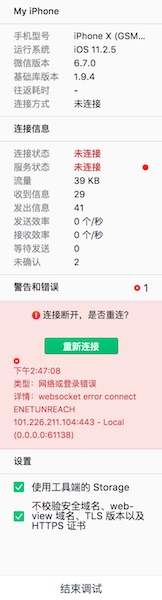
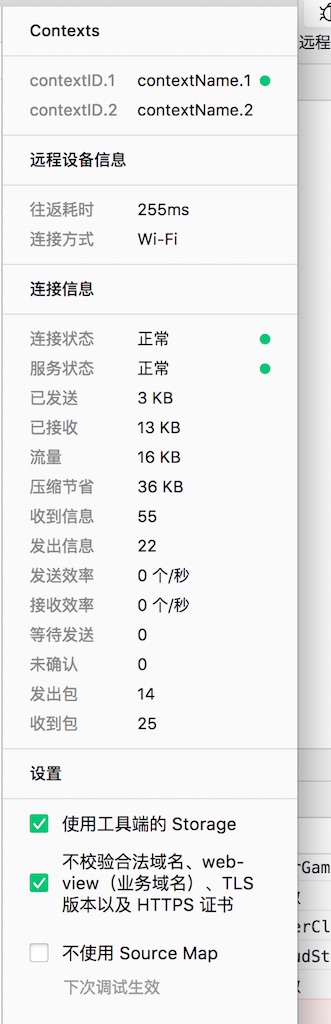
The information view on the right shows information about the phone, network connection.Mobile phone information shows the phone model, system, name, WeChat version and other information, as well as communication delay.The smaller the communication delay, the smoother the communication with the phone.
In "Connection Information," the connection information of the tool to the server is displayed, including connection state, server state, and so on. When connection failure or server blockage affects the process and smoothness of debugging, this state is displayable here. When the connection state is "closed," it indicates that debugging has been terminated.
"Warnings and Errors" displays recent errors and warning information. If the network connection is disconnected, the developer will be asked if they need to reconnect.
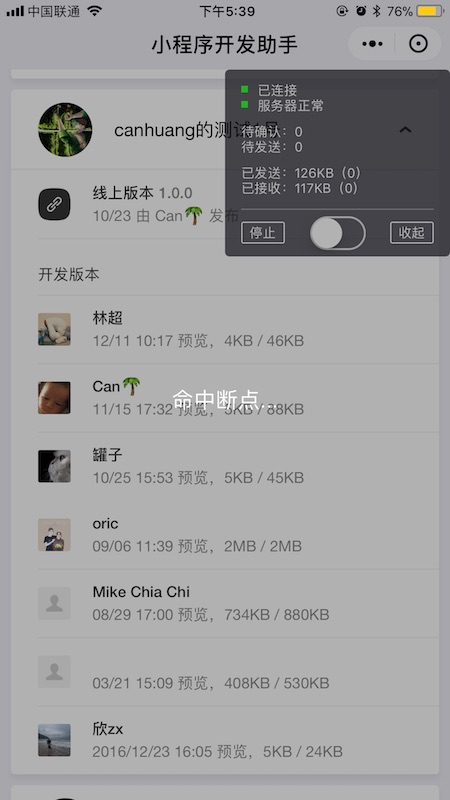
# Show on mobile phone
The mobile terminal during debugging is shown as follows.
When the phone is networkless or enters a breakpoint state, a floating point prompt will appear and prevent further action.
# MiniGame Remote debugging
Currently only support 1.02.1809260 and above tools, iOS 11.2 ~ 11.4.1System 6.7.2 and above version WeChat guest account, and Android system 6.7.3 and above version WeChat guest account.
Unlike Weixin Mini Program, the "Contexts" bar may appear on the right side of the debugging window, where you can click on the different JavaScript contexts you want to debug.
By default, the tool uploads a SourceMap with the full source code for debugging purposes. If you don't want to upload, or if you have a code linemap that is messy, you can close this option in the lower-right options and uncheck the "Automatic Compressing Confusion When Uploading Code" option in the project details.
Note: Storage panels are not currently supported.