# Features Overview
Note: This tool has been deprecated, please go to Real Machine Debugging Performance Tool
The real-world performance analysis tool enables the use of developer tools to record memory and CPU-related performance data on the real-world machine via a LAN connection to help developers better locate performance problems.WeChat Developer tools are supported since version 1.05.2106292.
# Forward preparation
- WeChat .
- Clients and tools (version needs > = 1.05.2106292) need to be located under the same local area network.
# Functional entry
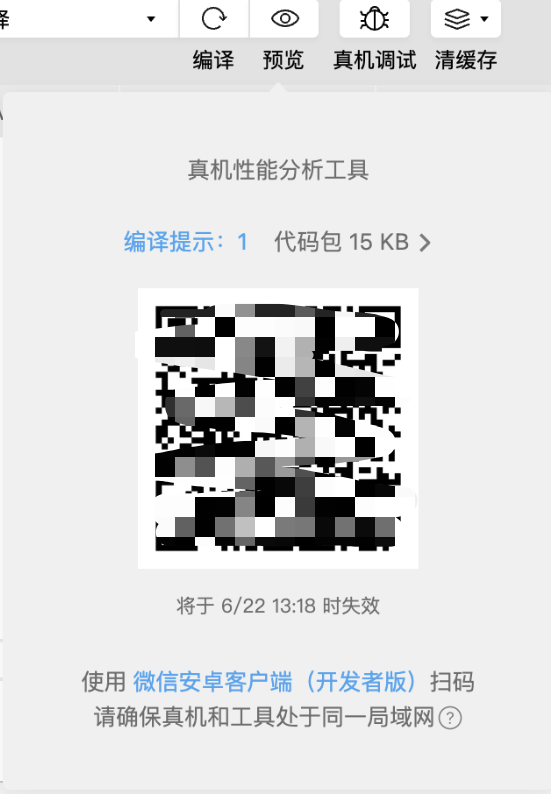
You can evoke a QR code pop-up for the real-world performance tool through Menu - Tools - Real-world Performance Analysis Tool.
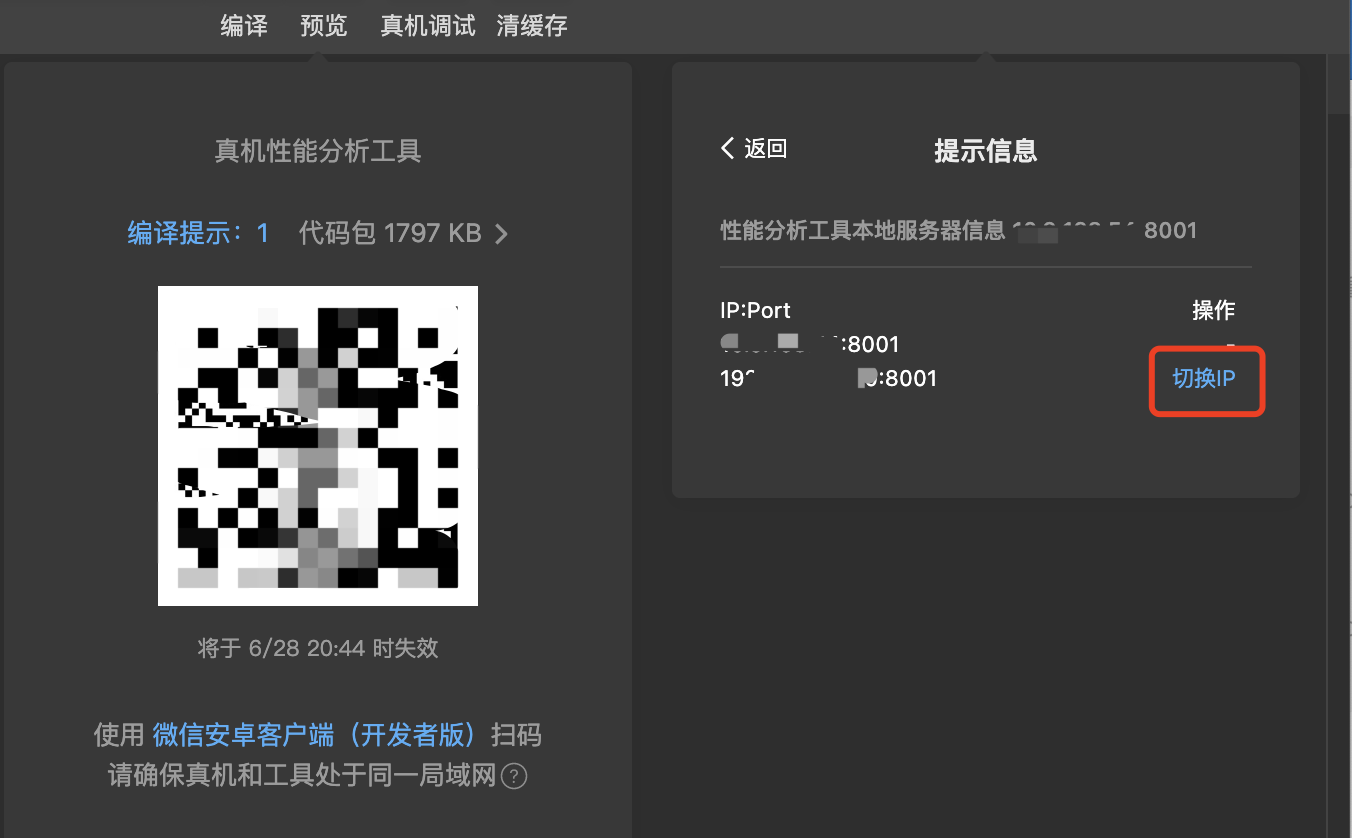
If your computer has multiple network cards or multiple network adapters, it may cause a problem with the default local area network IP. You can clickto make sure the real machine and tools are on the same local area networkto the right?to open the network IP switching panel:
# Recording performance data
With [WeChat Android Client (Developer Edition]]](./wechatdevedition.md) scanning, a window dedicated to recording performance data will open and the real machine will run the current [Weixin Mini Program \ MiniGame 。
NOTE:
- If you scan the code with the official version WeChat, the developer tools will not respond, no different from the normal preview.
- You also need to make sure that Weixin Mini Program or MiniGame is cold startup (you can completely exit WeChat or use the upper-right "..." menu - Development debugging - Exit to get cold startup).
If everything is fine, you will see the following pop-up window:
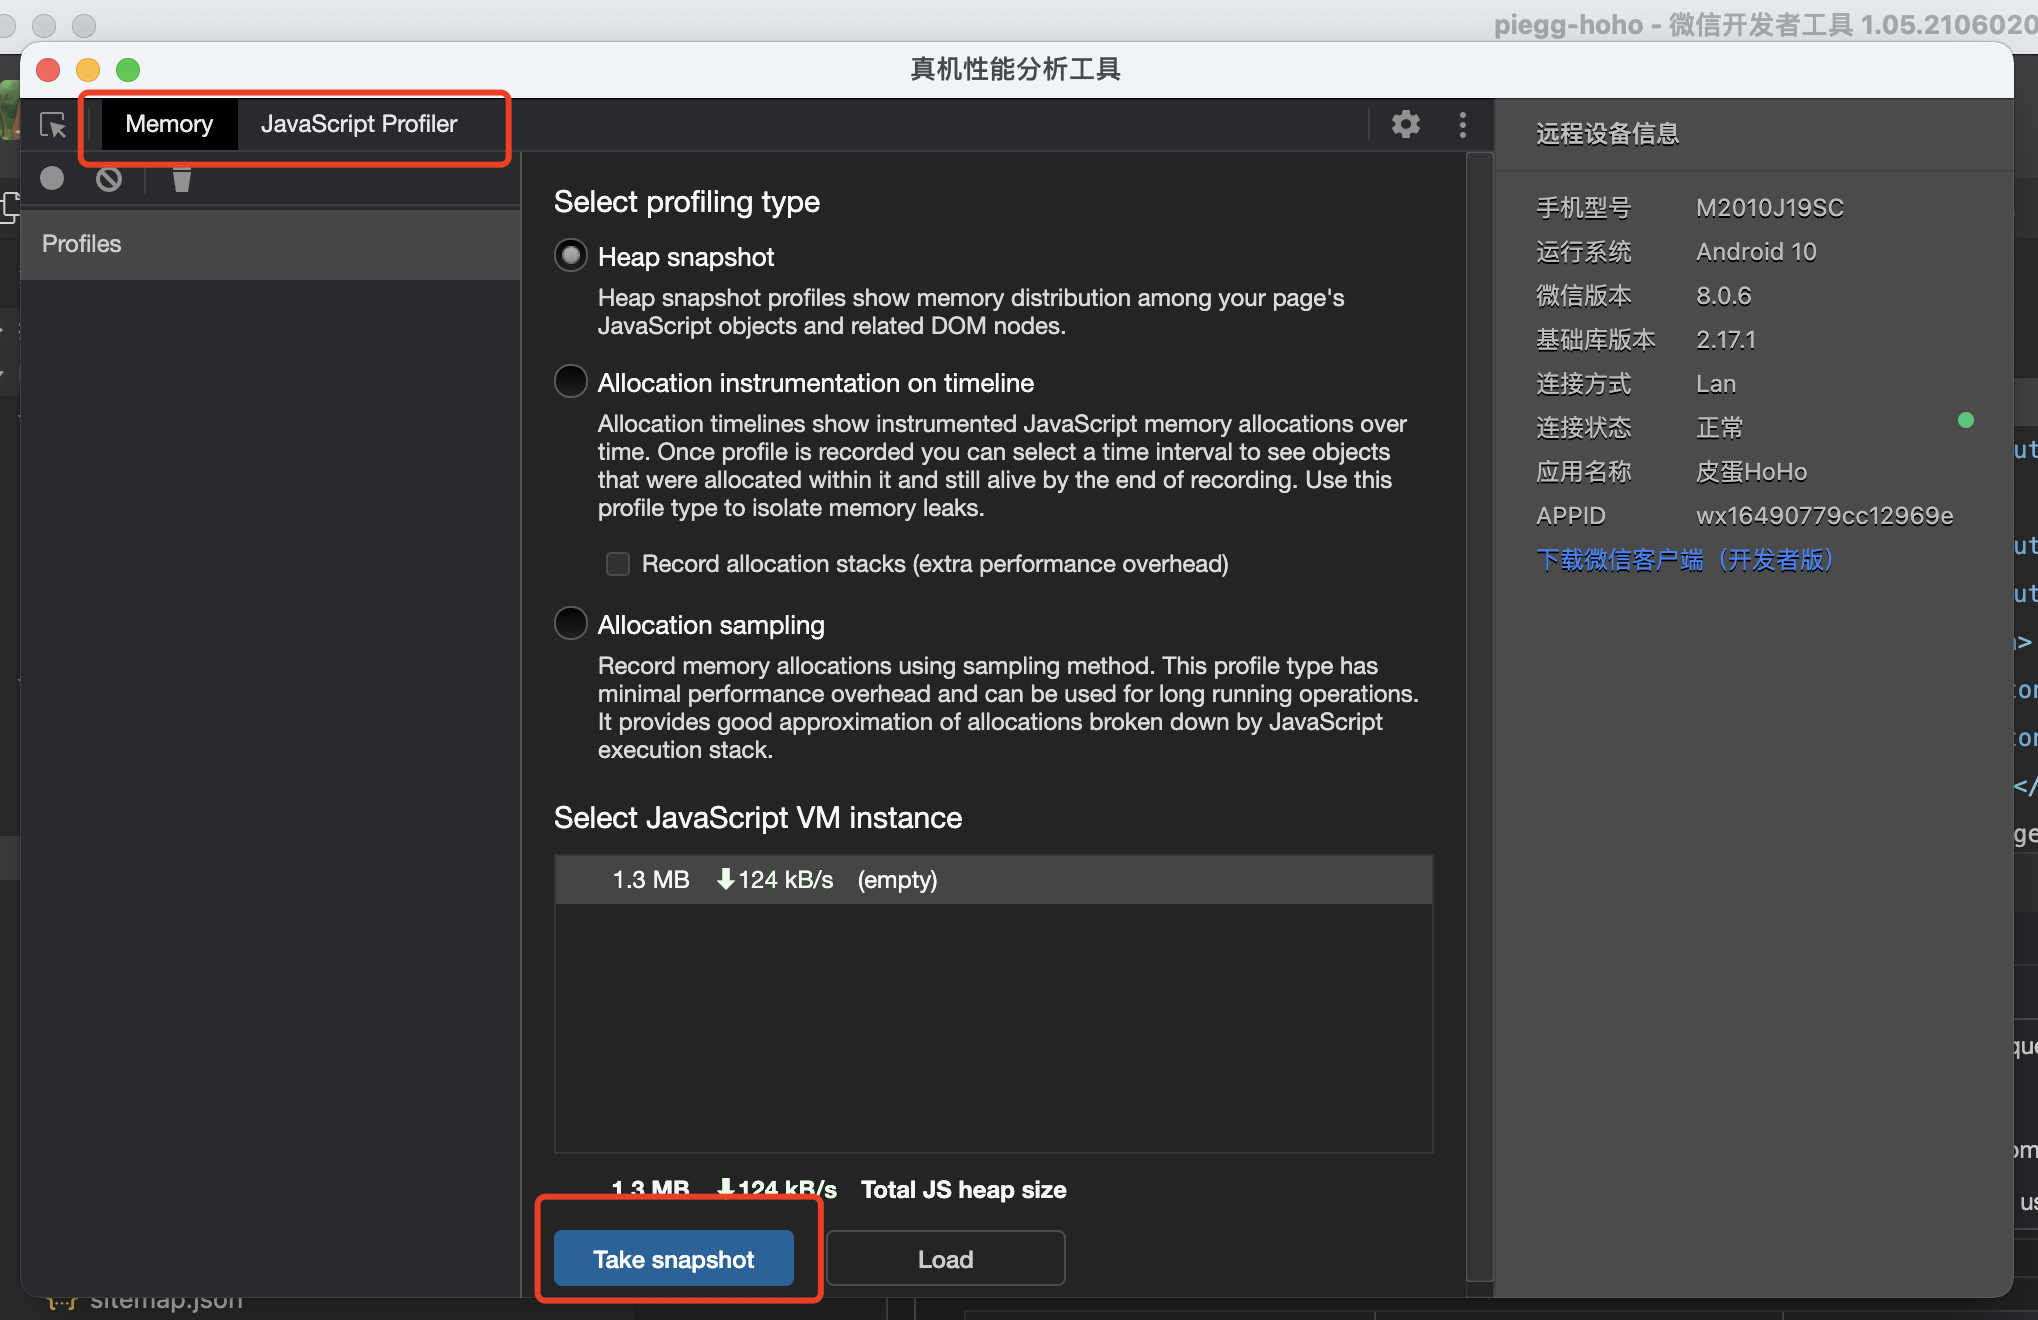
There are mainly "Memory" panels and "JavaScript Profiler" panels
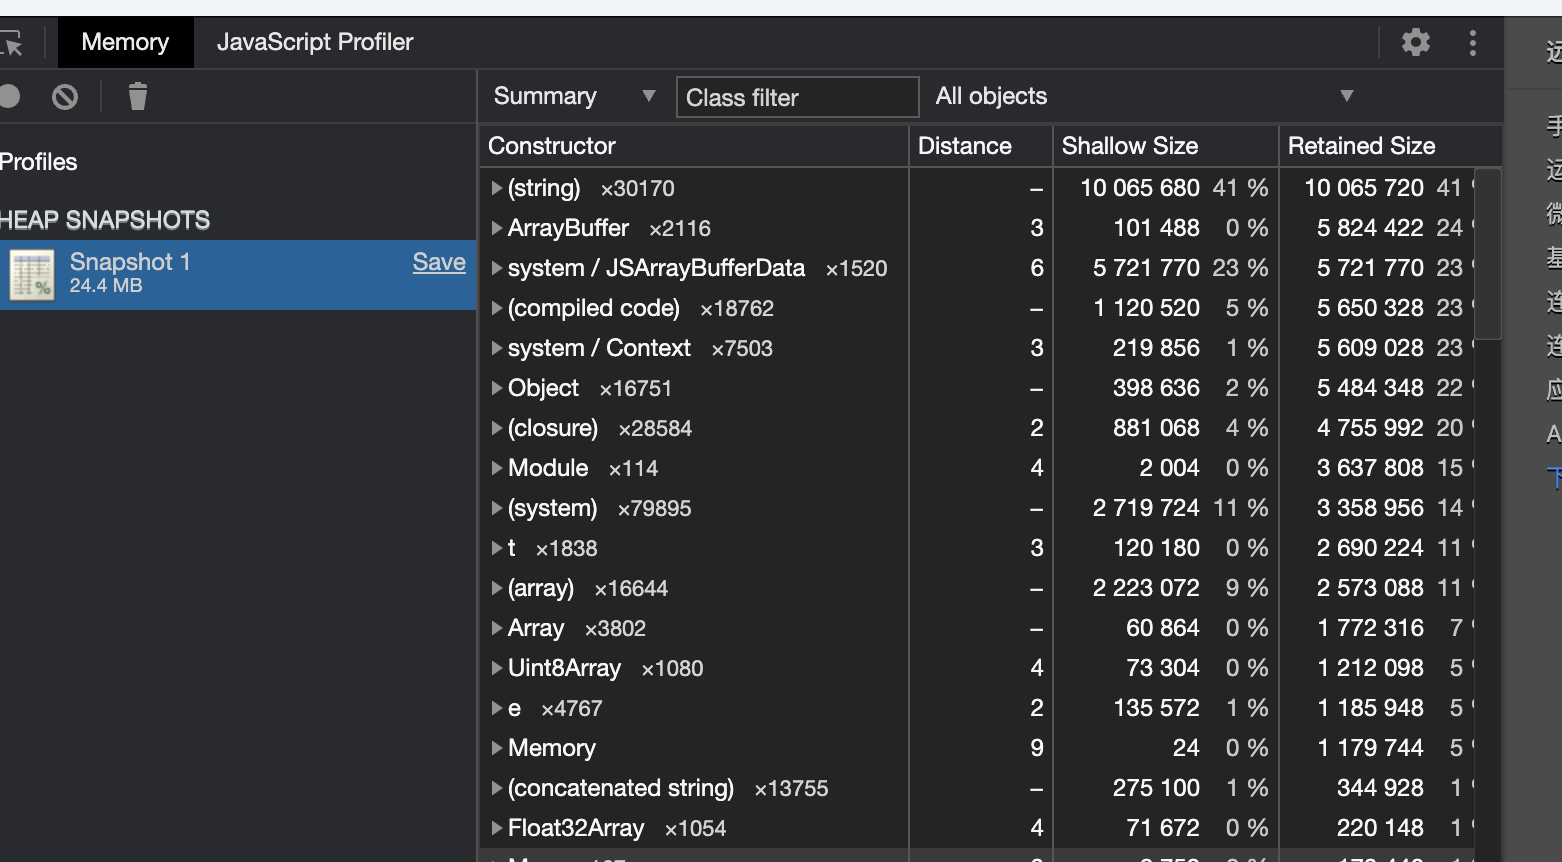
# HeapSnapshot recording
In the "Memory" panel, click "Take snapshot" below to record the current memory data of the Weixin Mini Program\ MiniGame running on the real machine.After you click, you need to wait a little while before the real machine sends the data back to the tool.
Heap Snapshot data can be used to analyze memory usage, such as whether or not a cache leak has occurred, and where it has occurred.
# CPU Profile Recording
In the "JavaScript Profiler" panel, click "start" to start recording, and click "stop" to end recording.
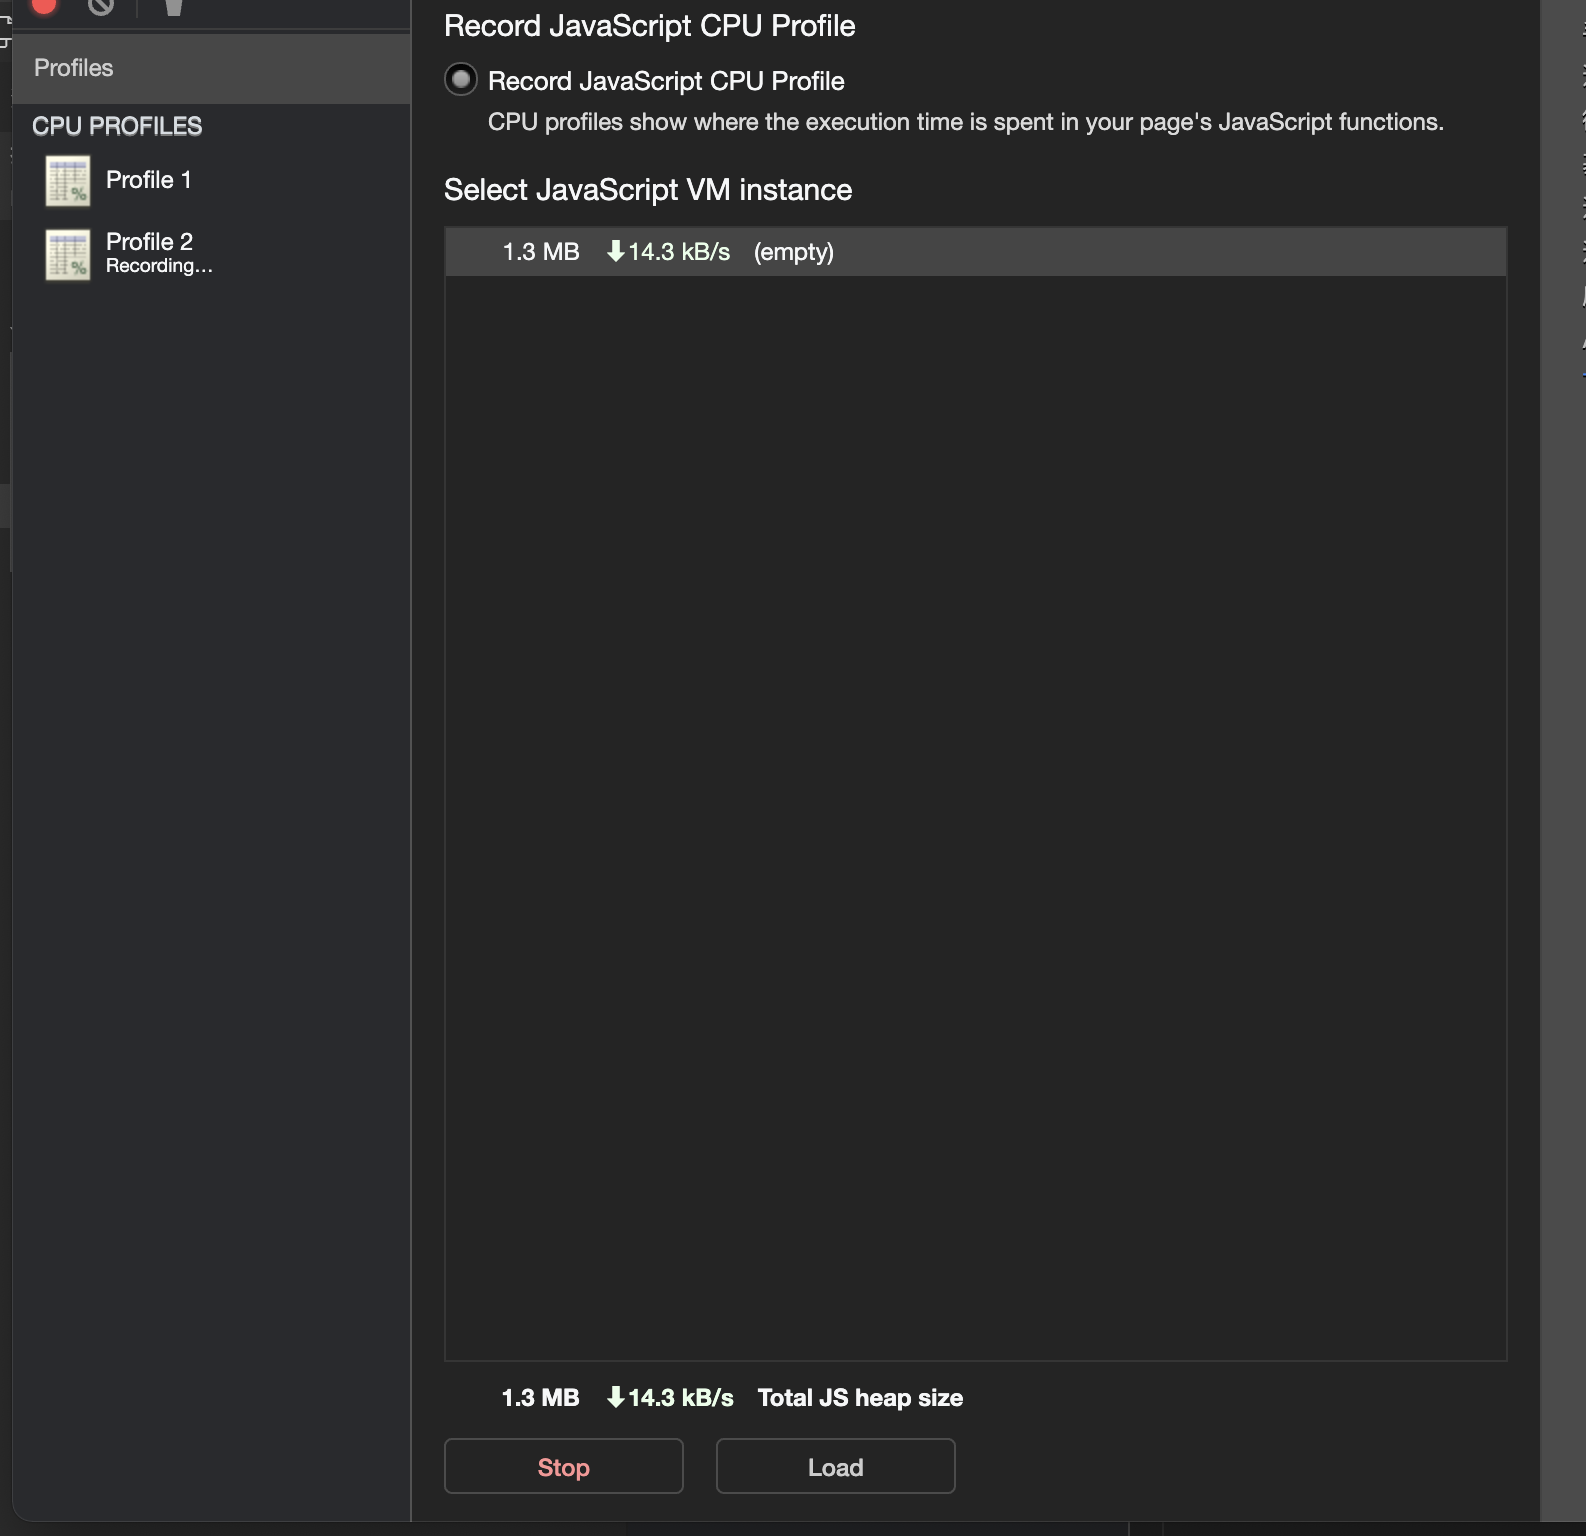
After clicking stop, the real machine will send the data back to the tool.
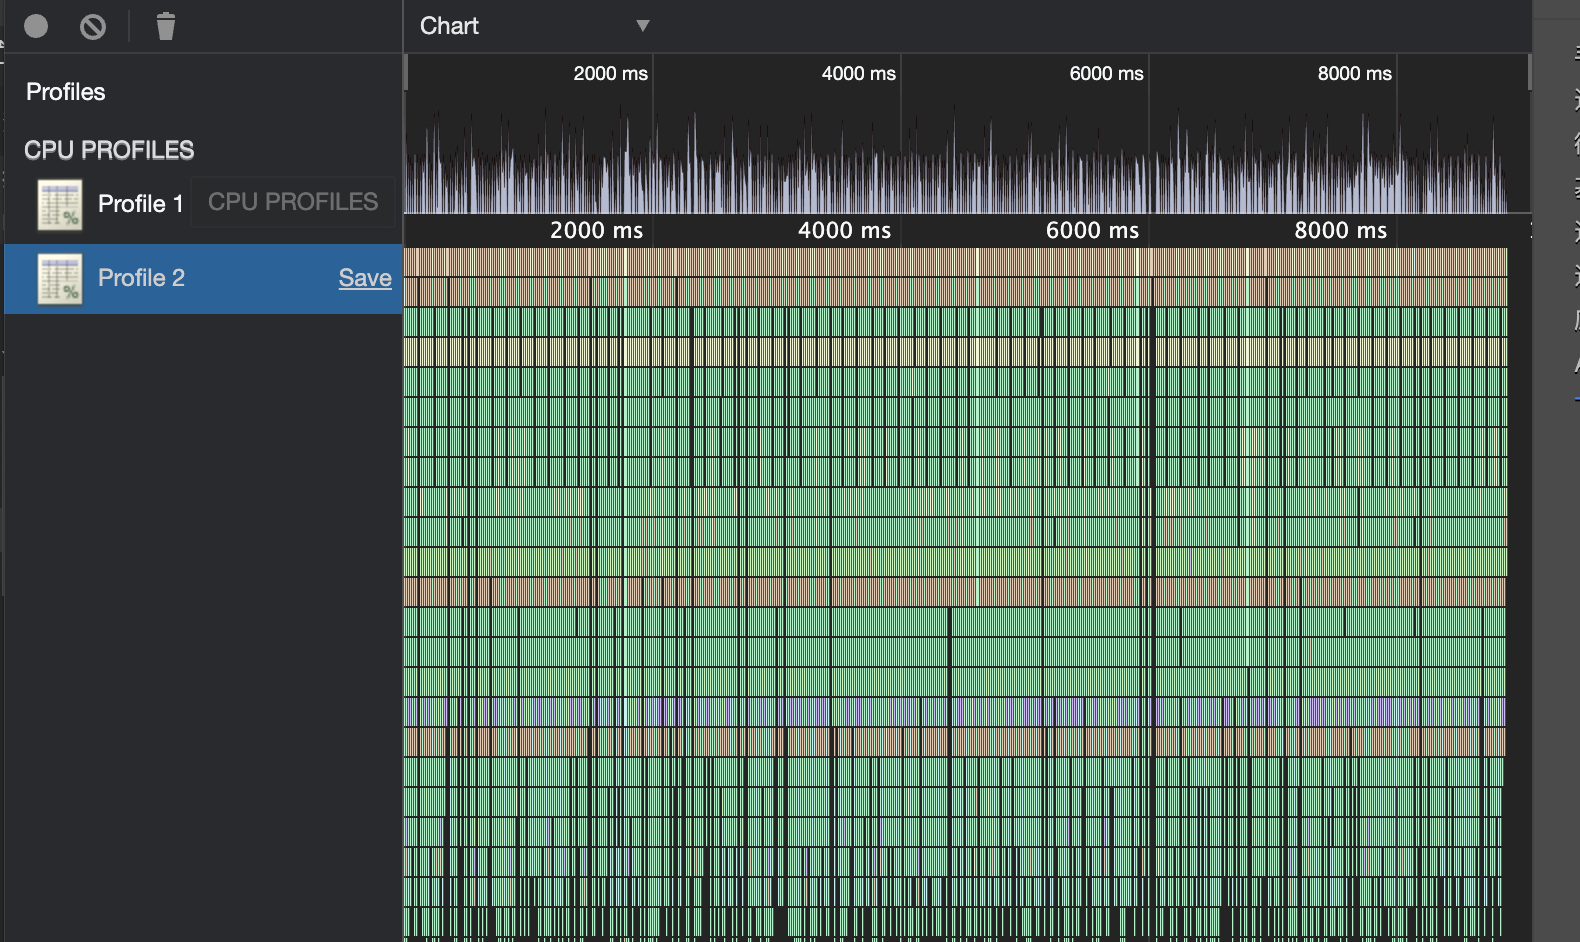
CPU Profile data can be used to analyze JS script execution, time spent per frame, etc. For example, it can be used to analyze which functions take longer to execute and thus affect performance.
# PerfDog Performance Dog Plugin
PerfDog is a performance analysis tool for mobile applications.It has now been integrated into WeChat Android client (for developers) and provided a corresponding debugger plugin that can be used on the performance analysis tool of WeChat developer tools.
# Forward preparation
- WeChat .
- Clients and tools (version needs > = 1.05.2106292).You need to be located under the same local area network.
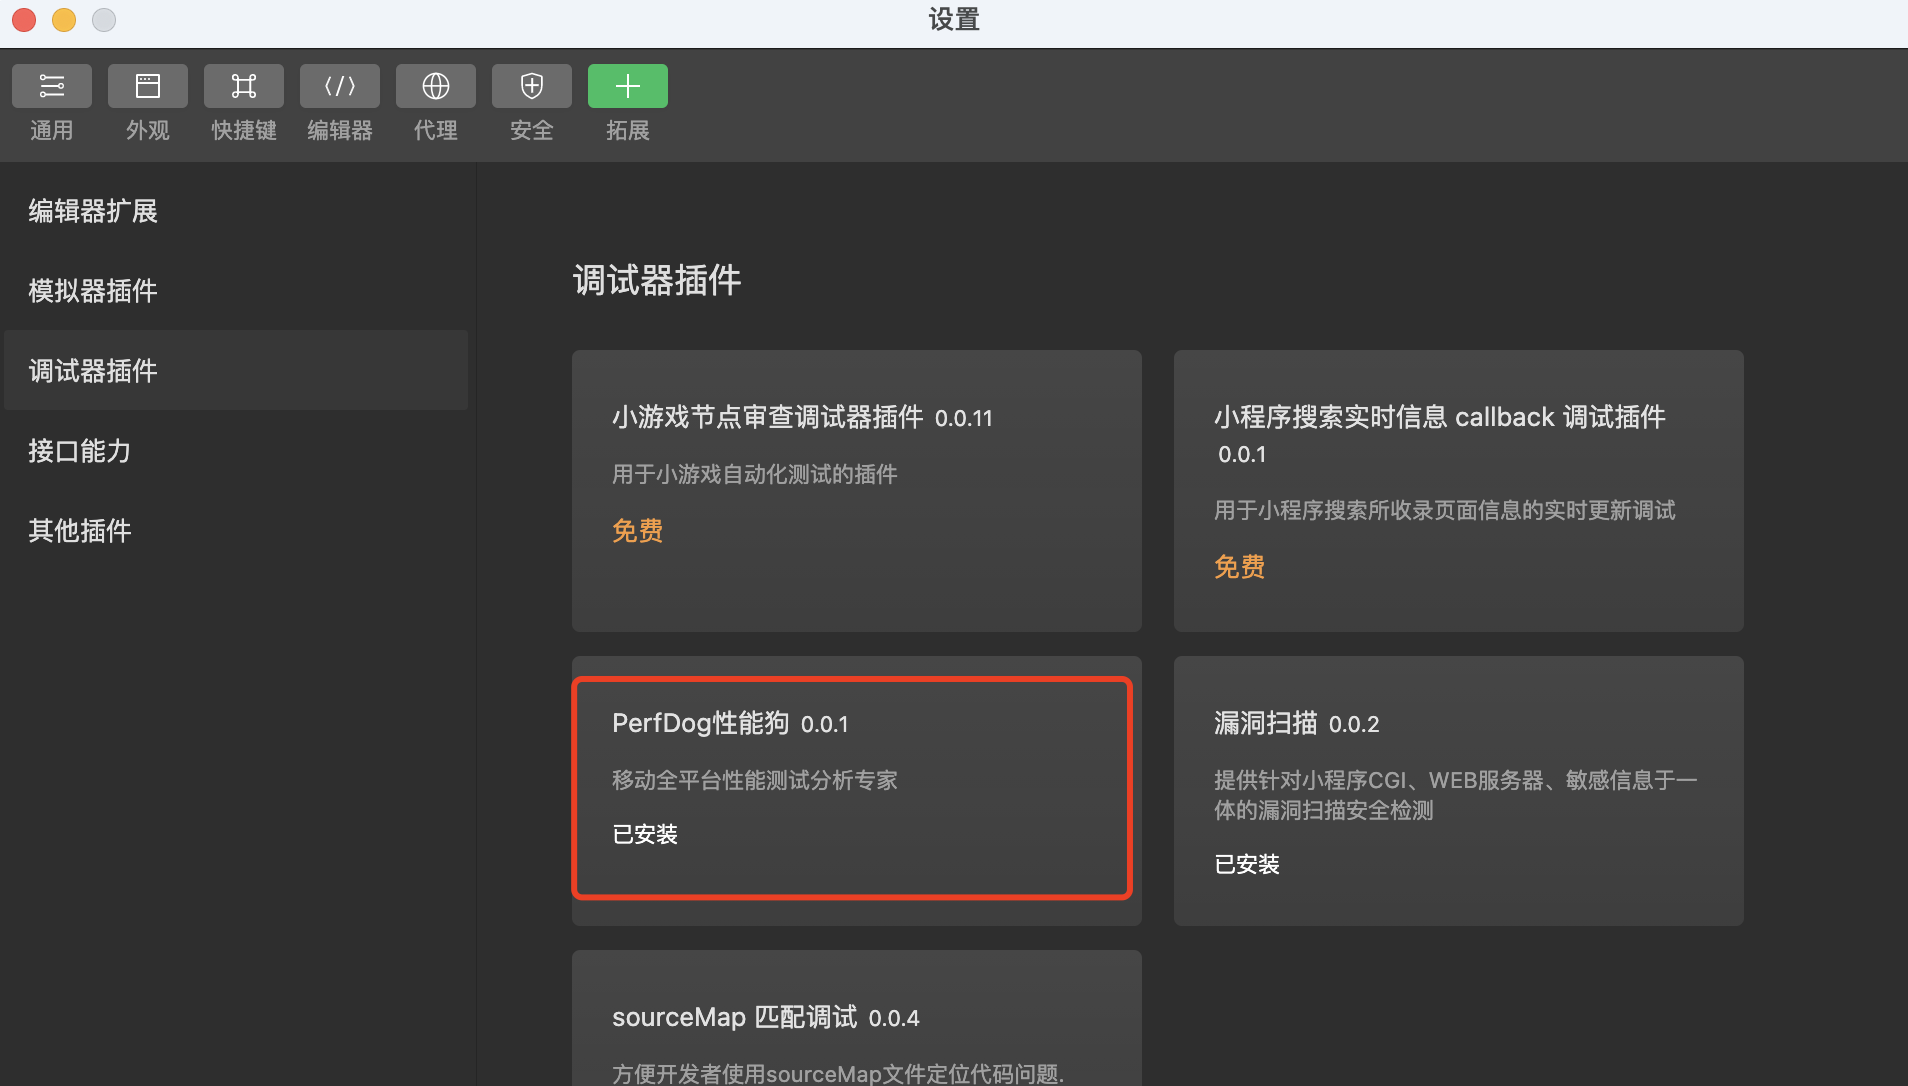
- Install the PerfDog debugger plug-in for the WeChat developer tools.The PerfDog plug-in can be found in the menu - Settings - Extension Settings - Debugger plug-in
# Record PerfDog performance data
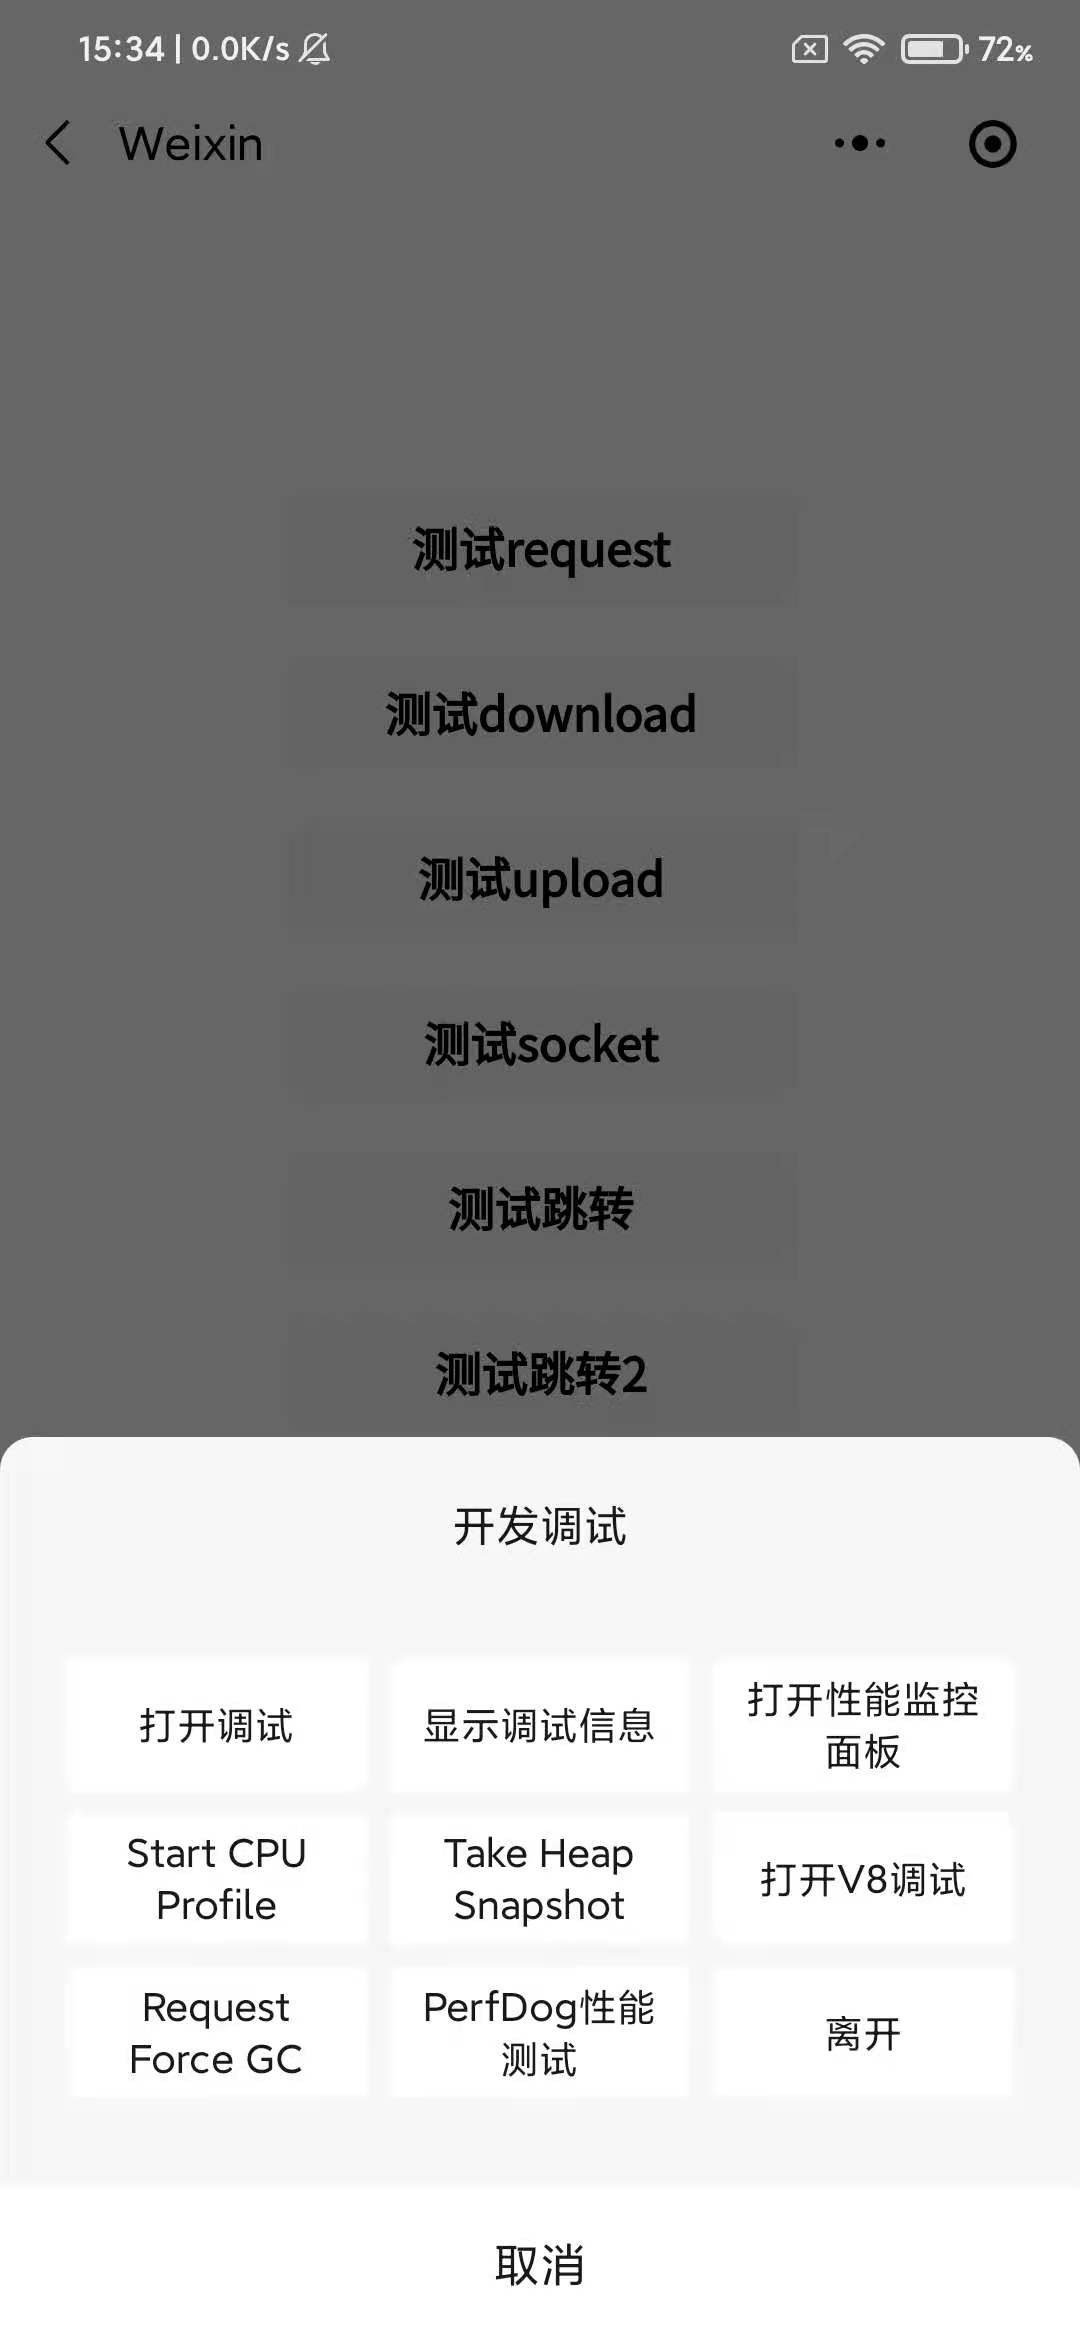
Click Weixin Mini Program or MiniGame on the top right corner of the... "" menu to find the Development Debugging - PerfDog Test.
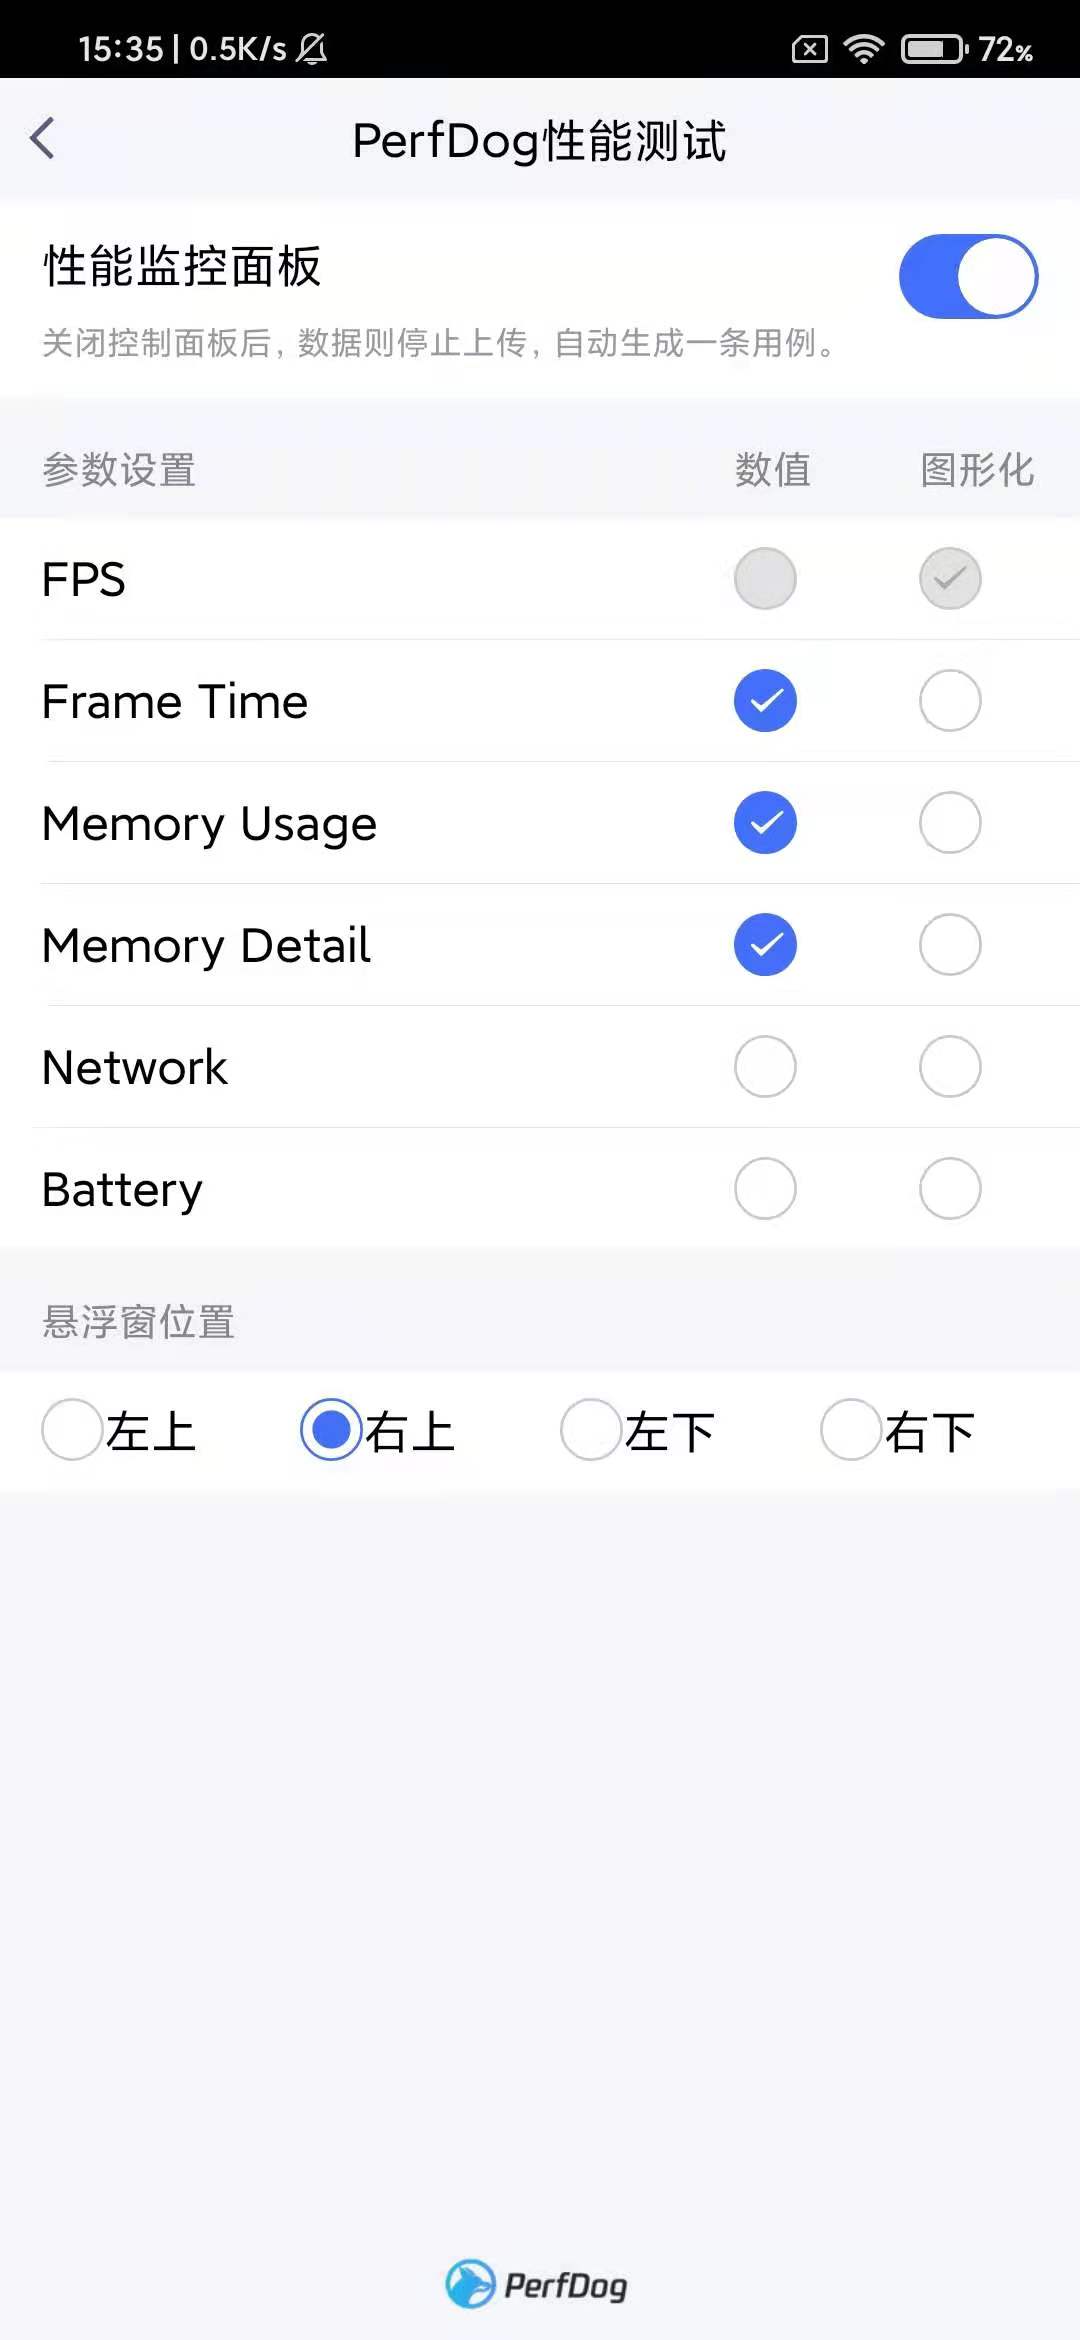
Click on the record switch, and turn on the performance data option of your concern, and finally click the back button in the upper left corner to go back to Weixin Mini Program or MiniGame:
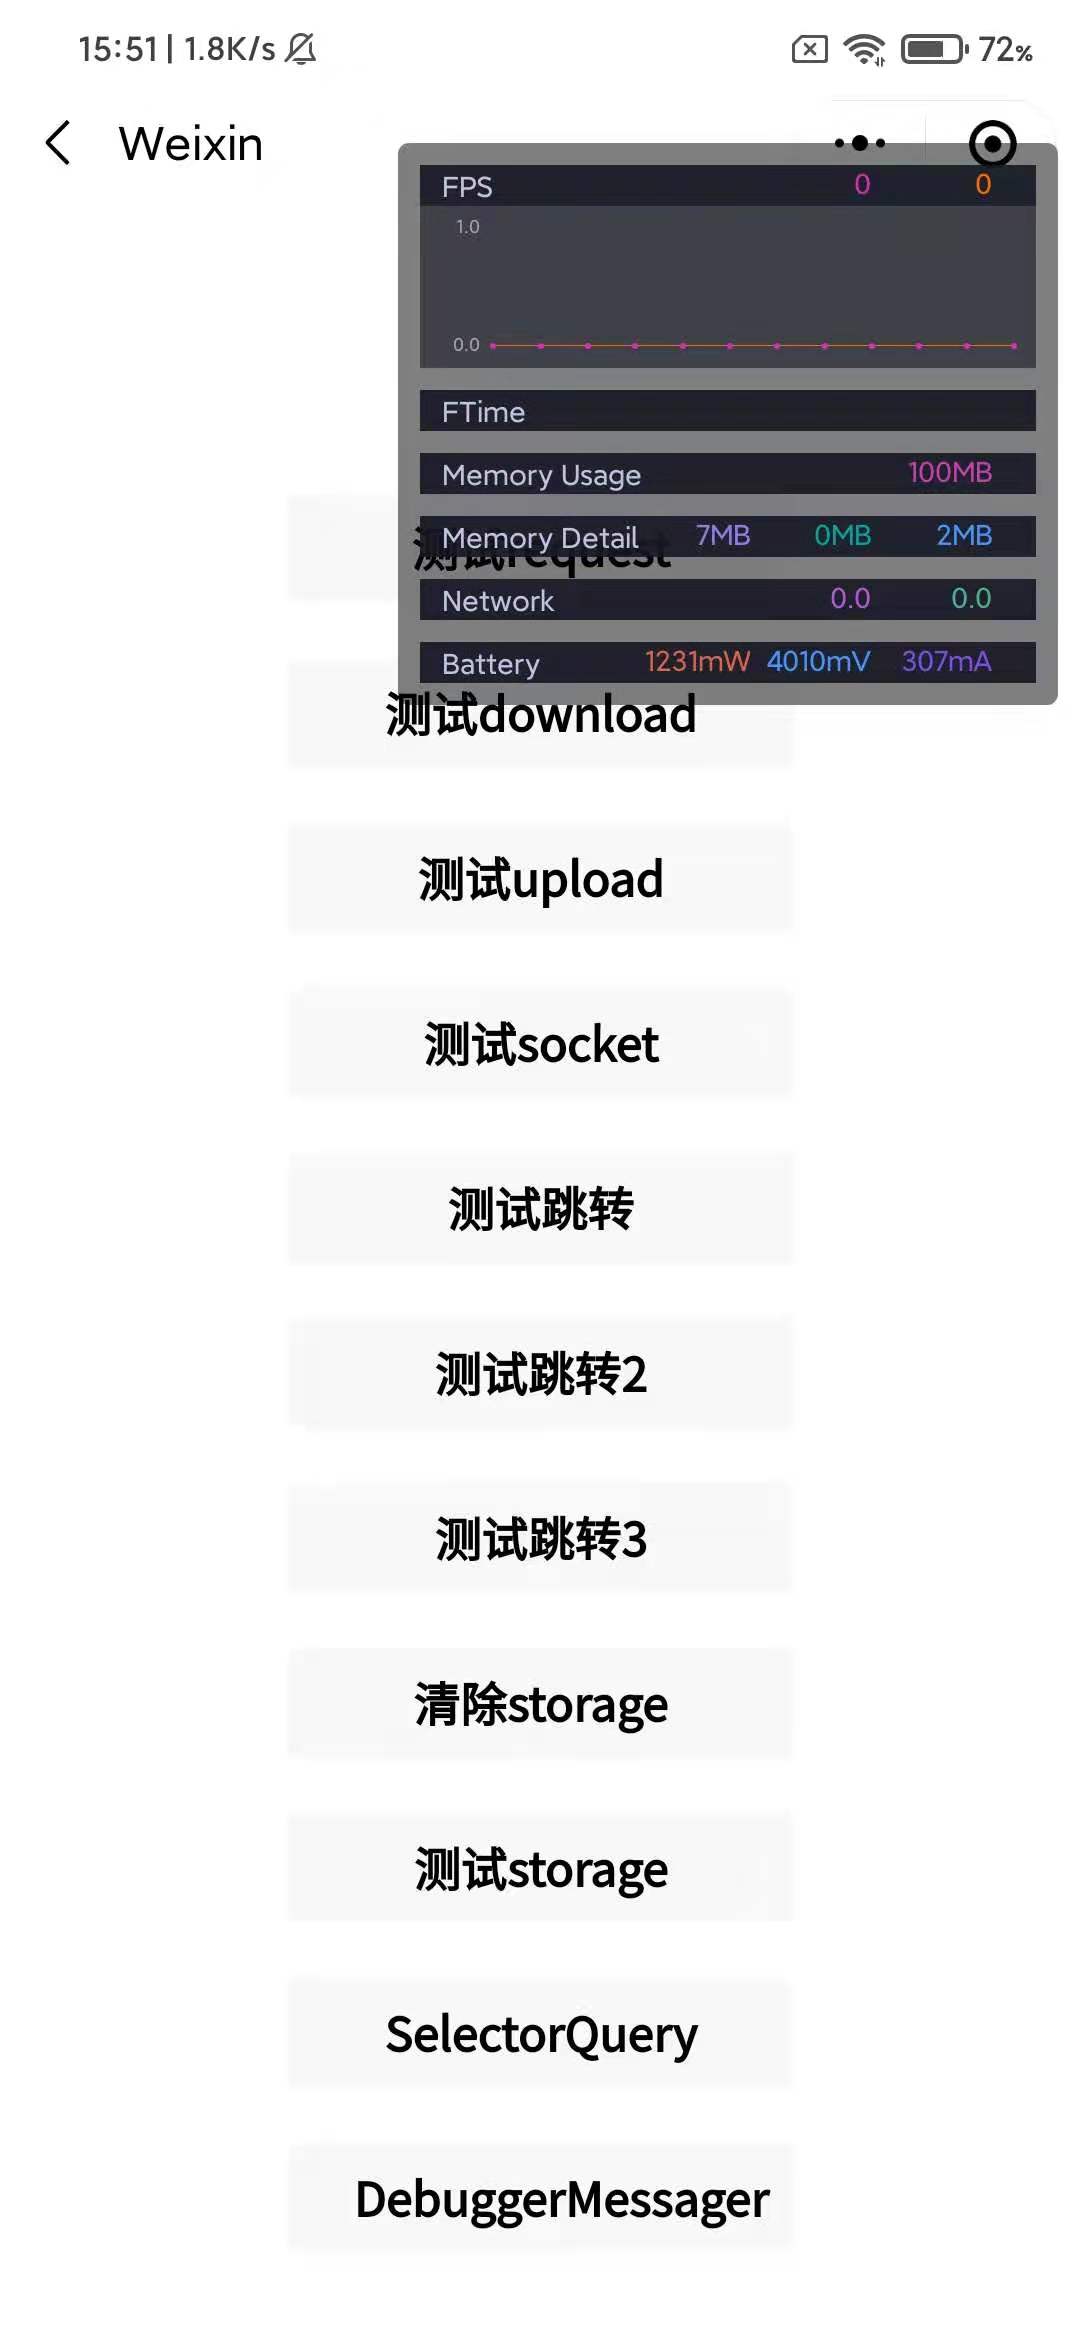
At this point, you can see the Perfdog performance recording window, indicating that recording has started.
And then through the upper right corner of the... "" menu - Development Debugging - PerfDog Performance Test - Turn off the PerfDog Performance Test switch, you can end the recording.
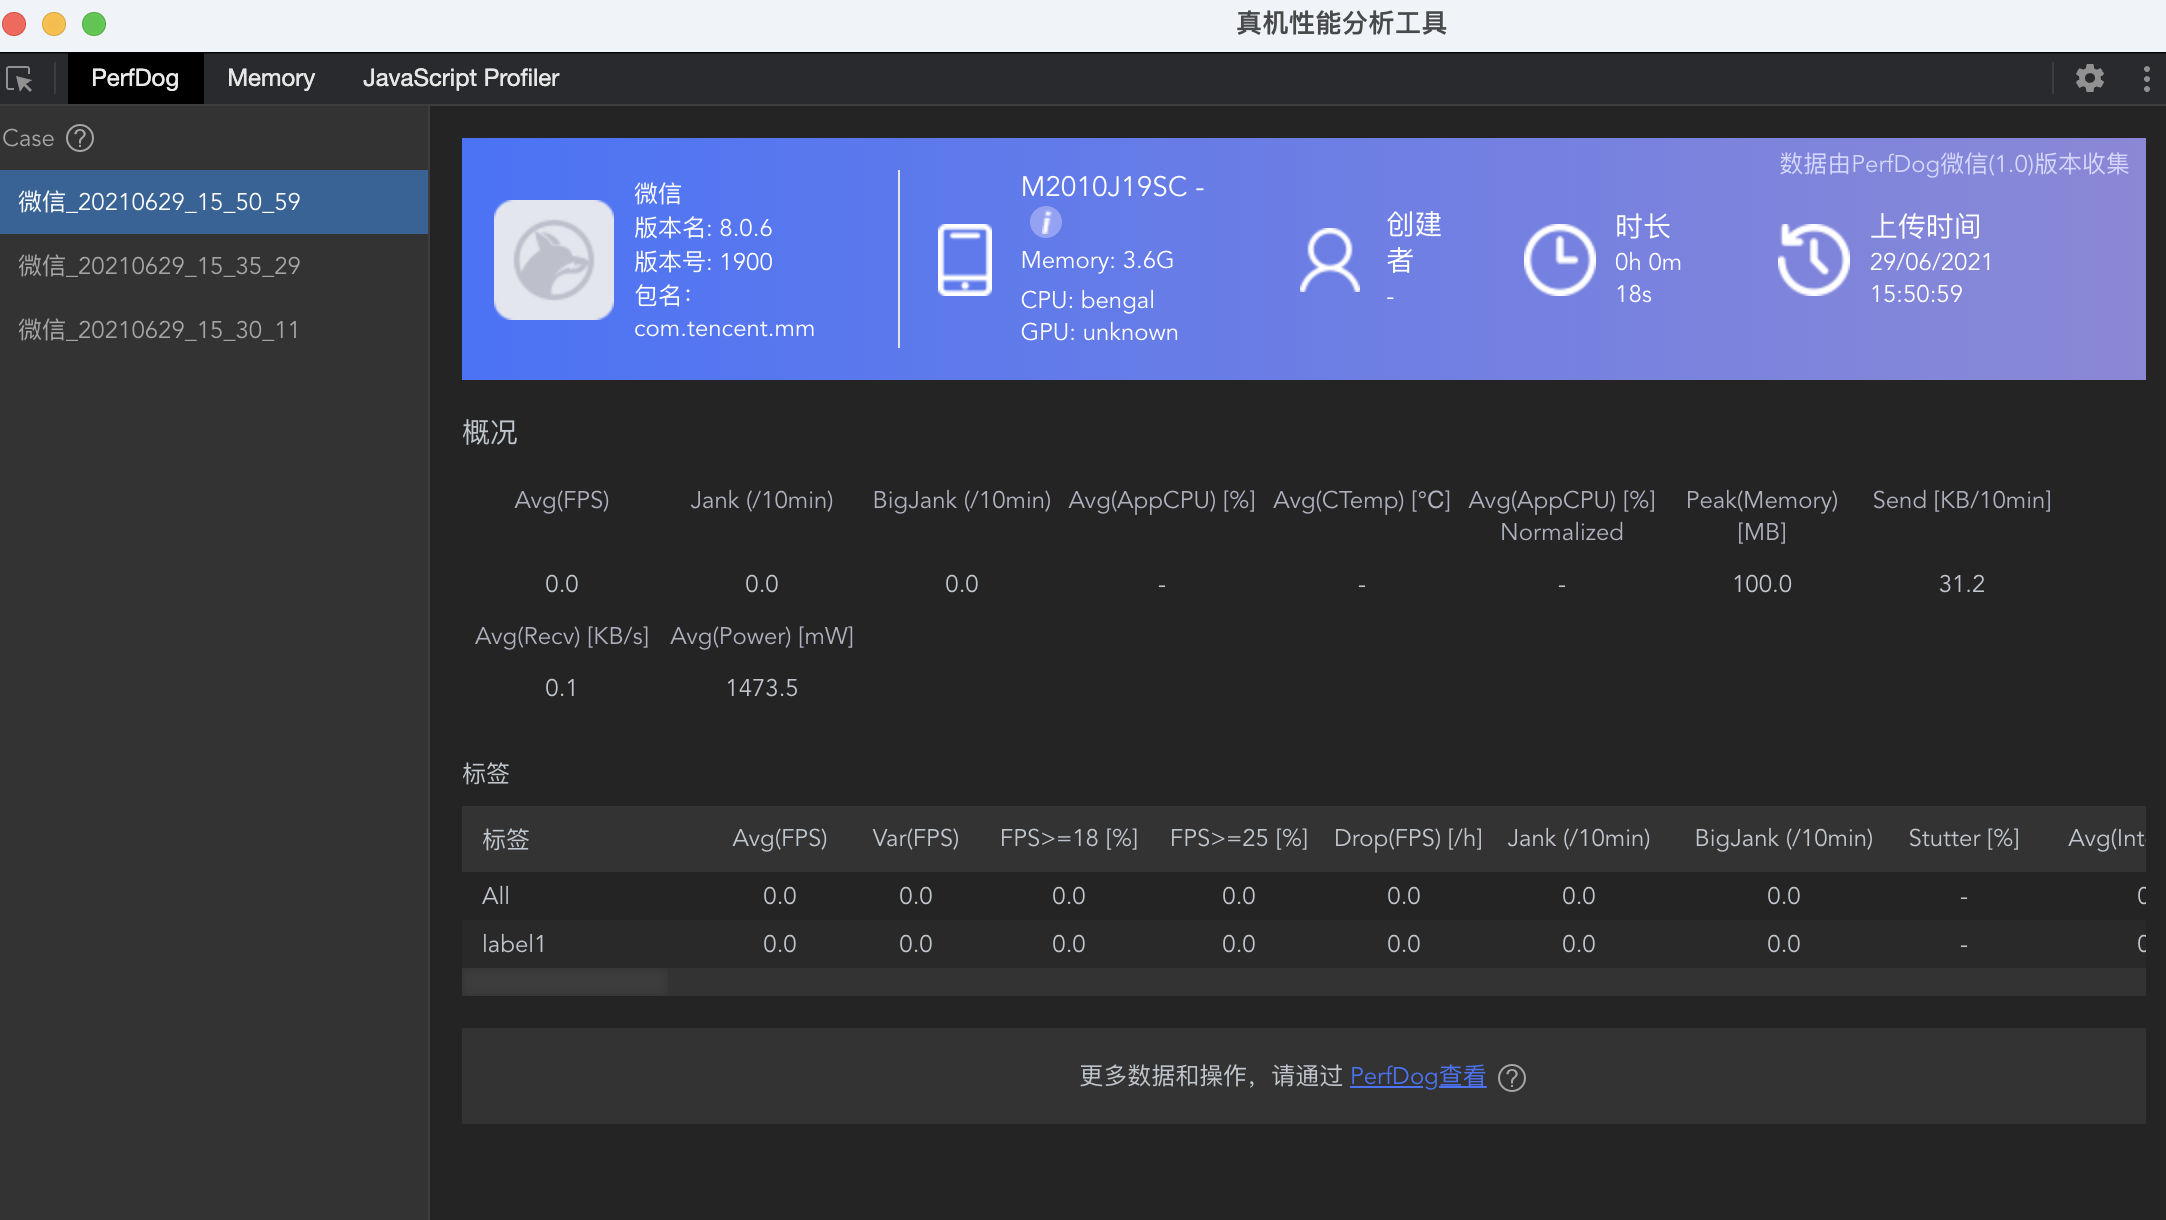
Follow the previous steps of to record performance data to scan the window of the real-world performance analysis tool and click the PerfDog panel to receive a performance test report from PerfDog: