The WeChat Developer Tools optimizes the flow of loading cpuprofile files to make it easier for developers to analyze cpu / memory information during MiniGame.
# Operating environment
- Download and install the Developer Tools version 1.02.1911192 or above at Underload .
# Loading profile file process
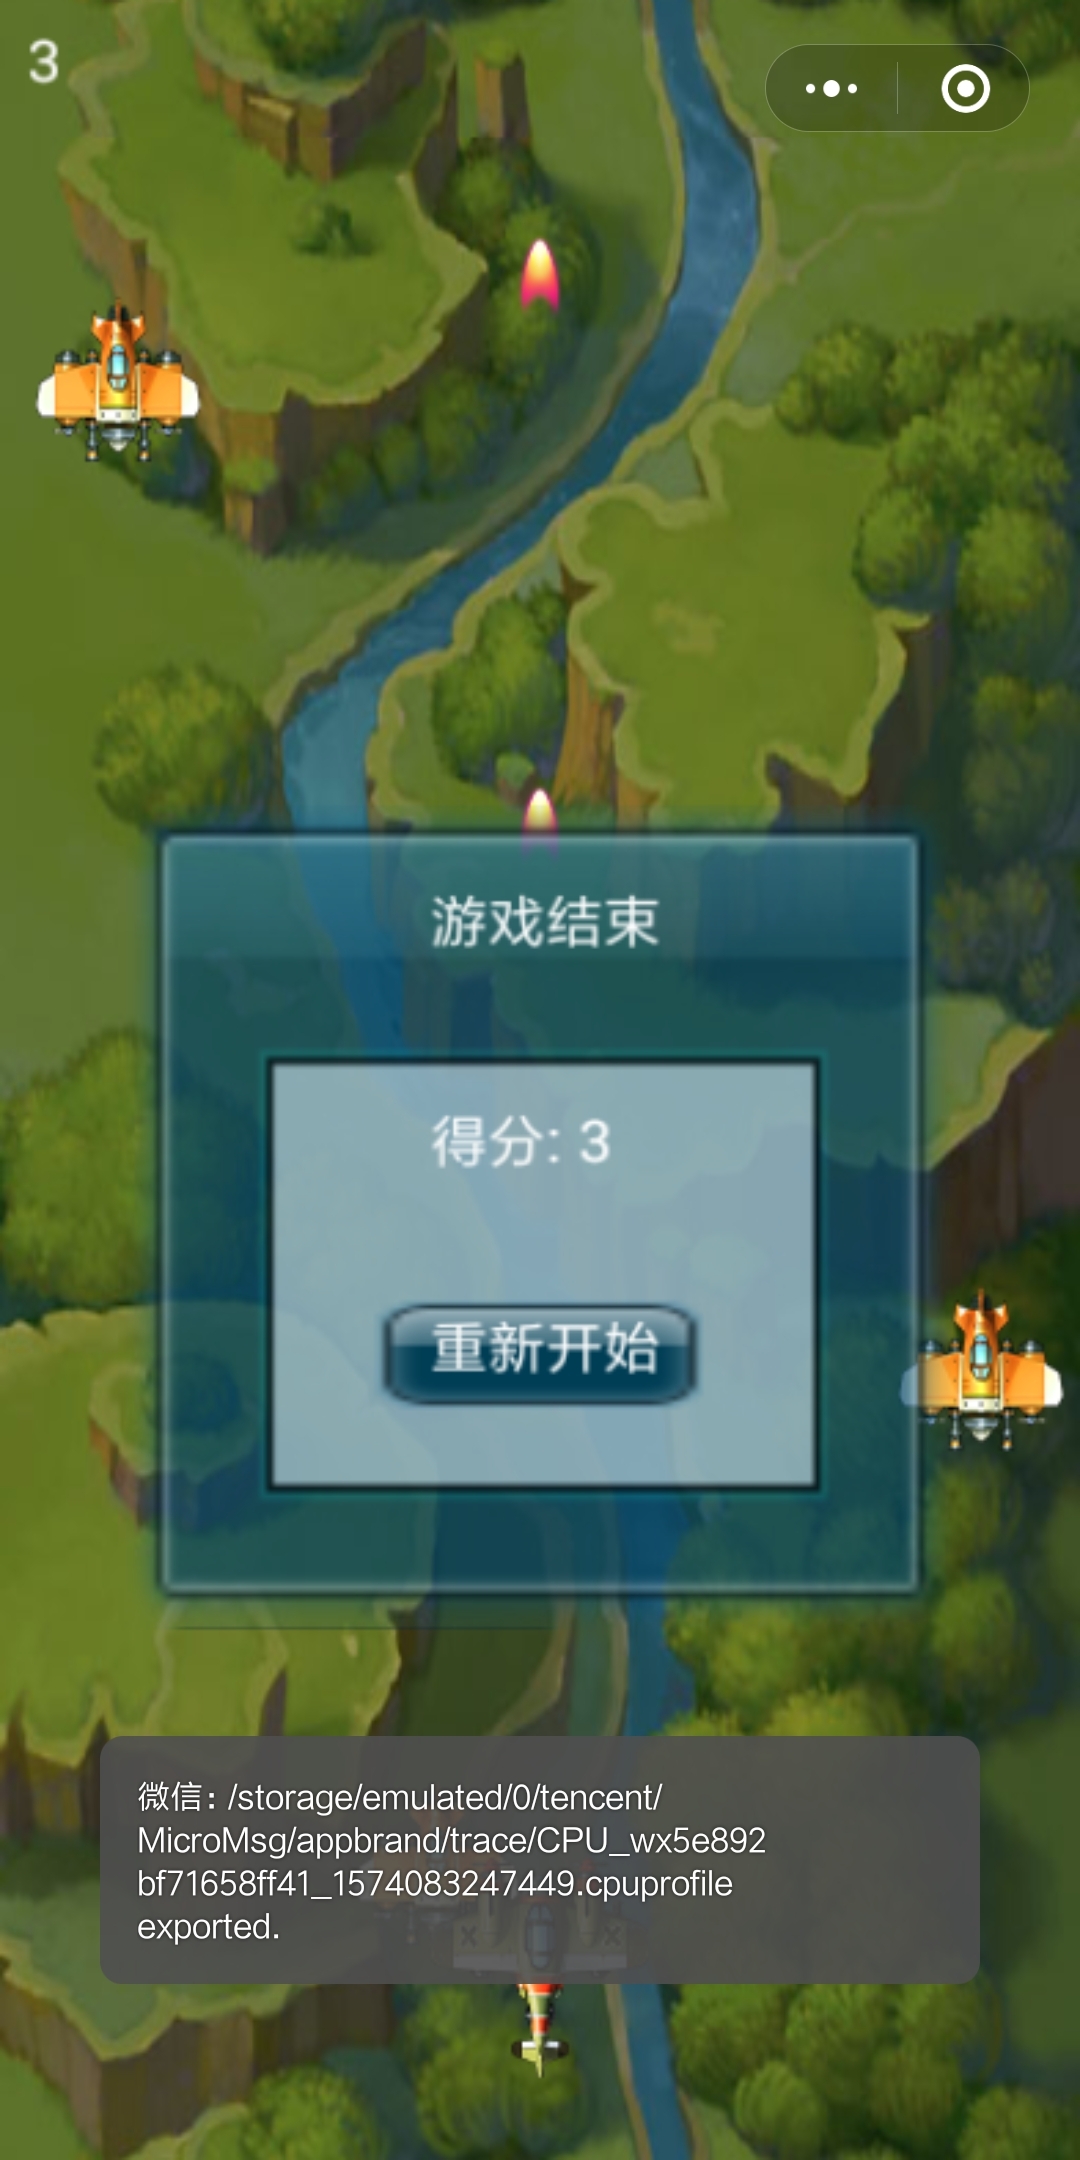
Developers can start recording cpuprofile information by preview- > upper-right capsule button - > developmentdebug - > Start CPUProfile
Developers can end recording cpuprofile information by previewing - > top right capsule button - > development debug - > stop CPUProfile
After that, a cpuprofile file will be automatically exported to the phone.
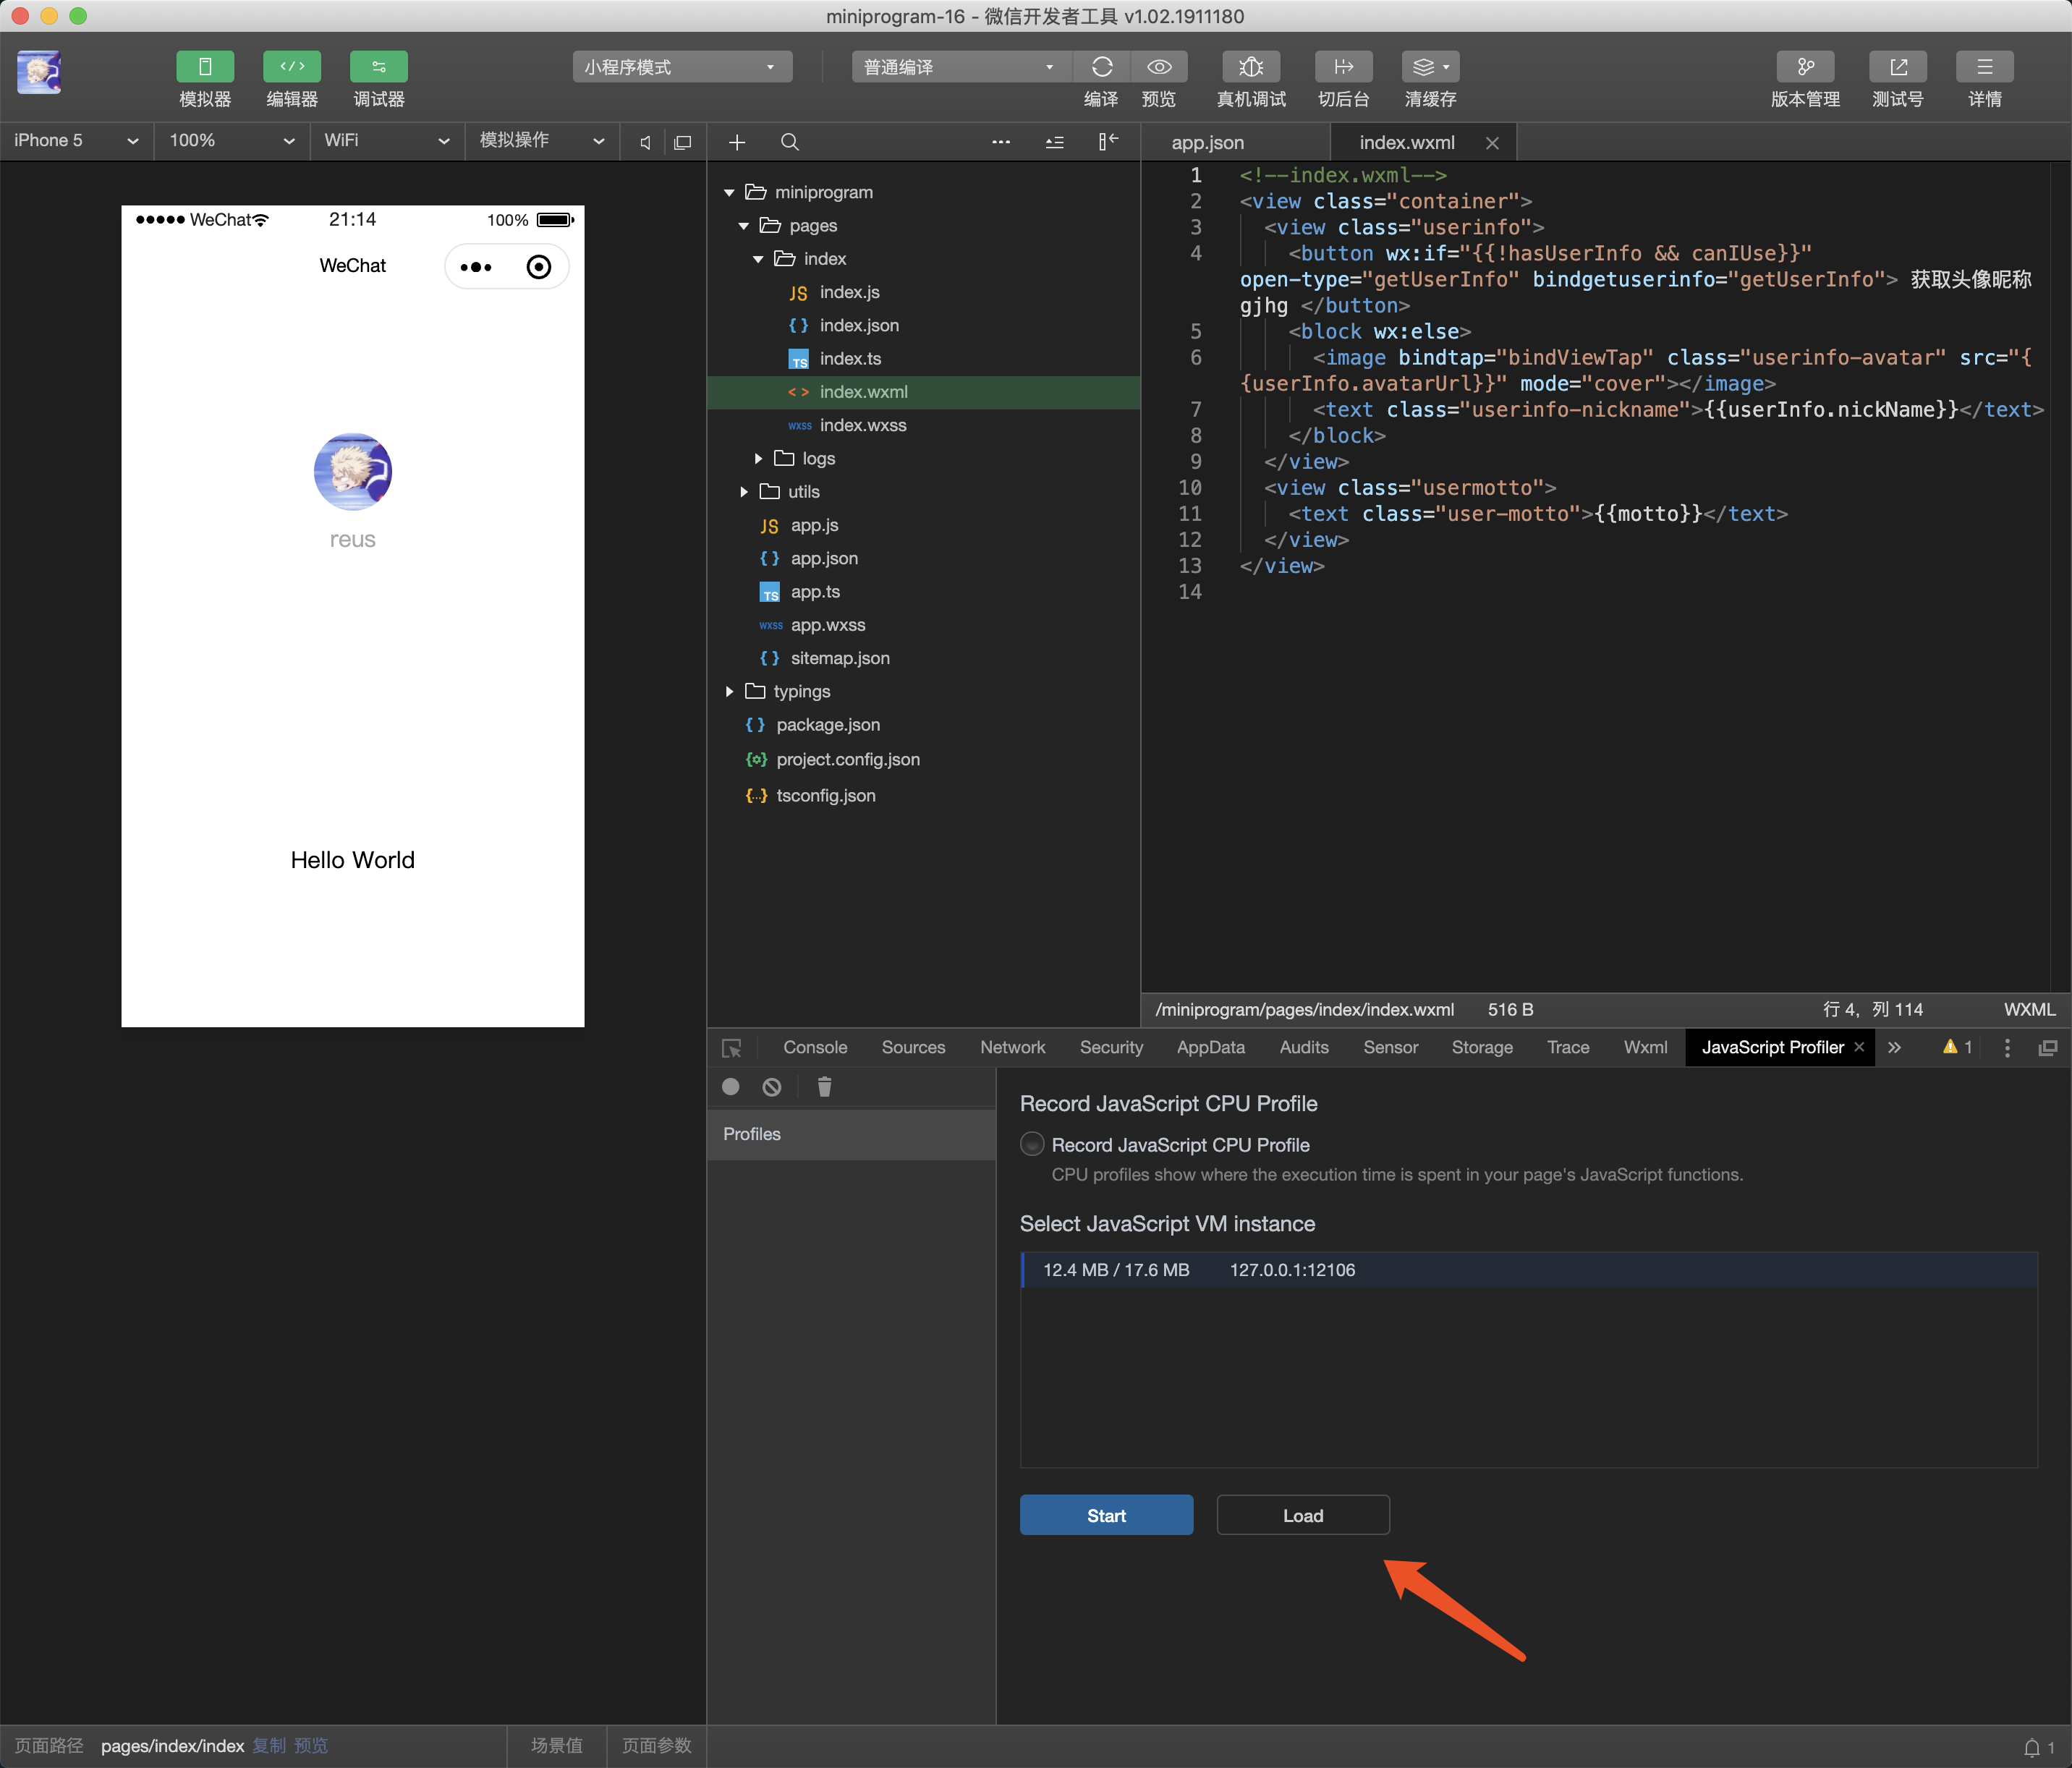
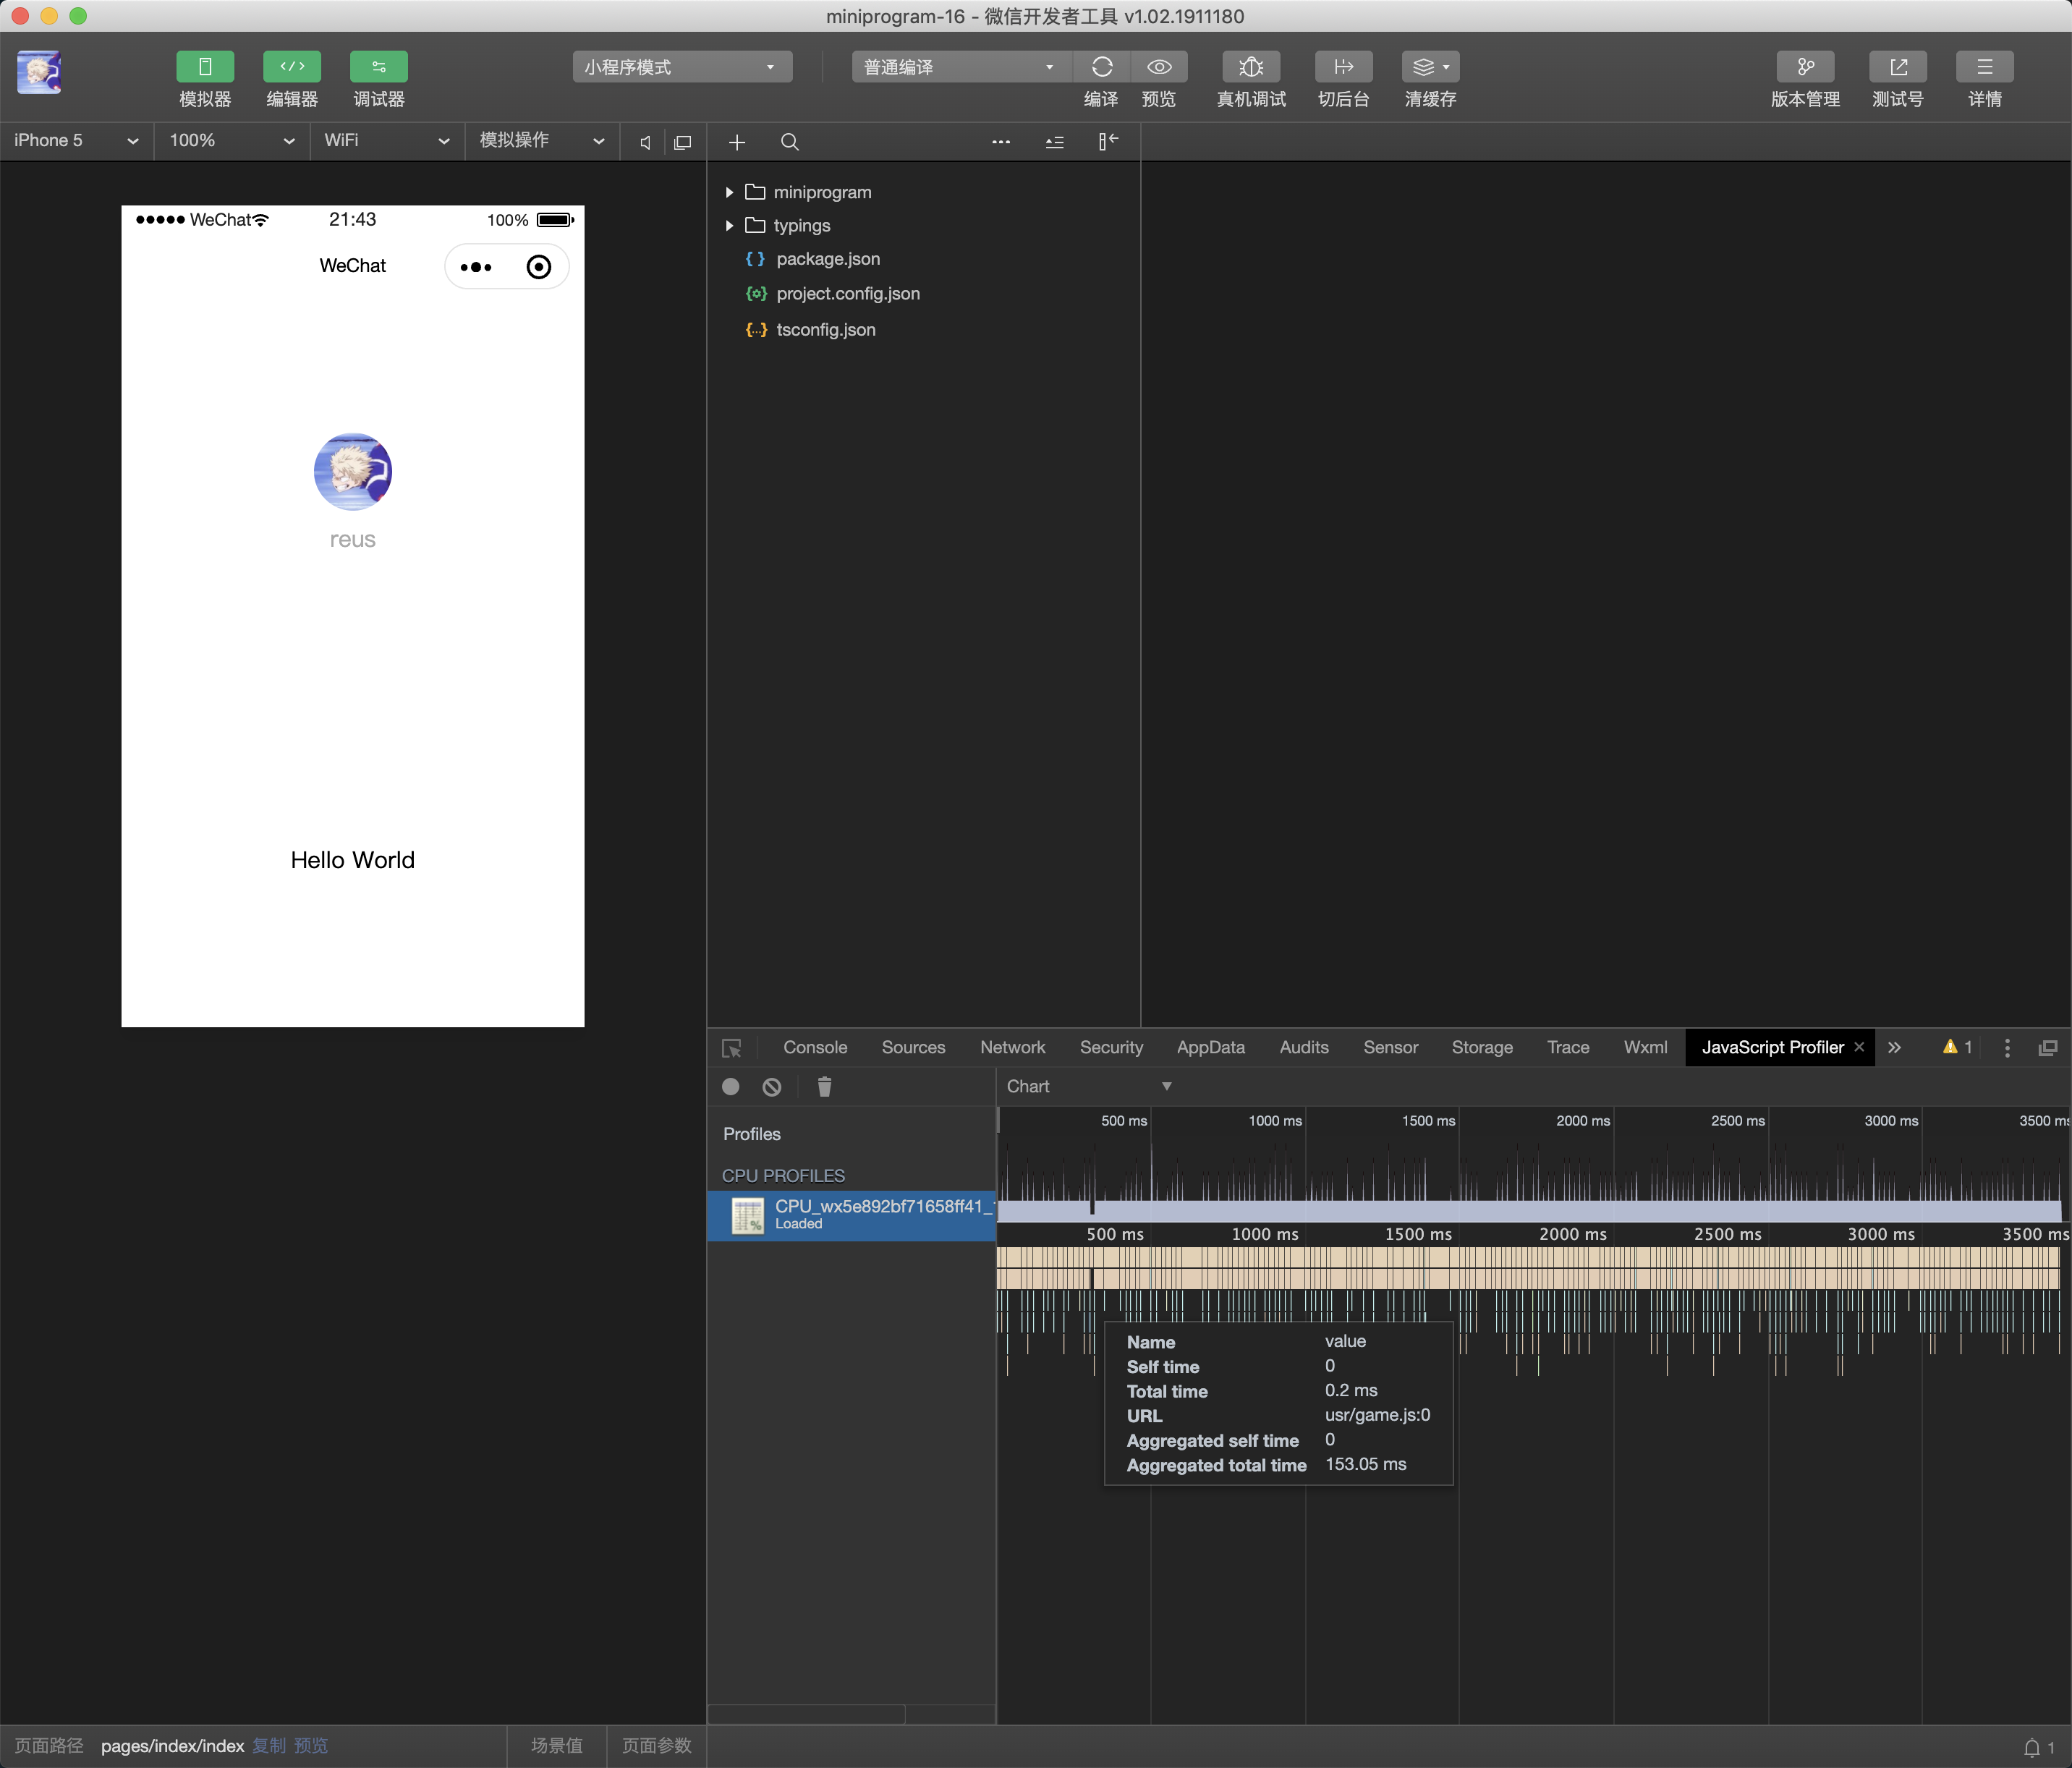
Open WeChat Developer Tools, open the JavaScript Profiler panel in devtools, and click load.
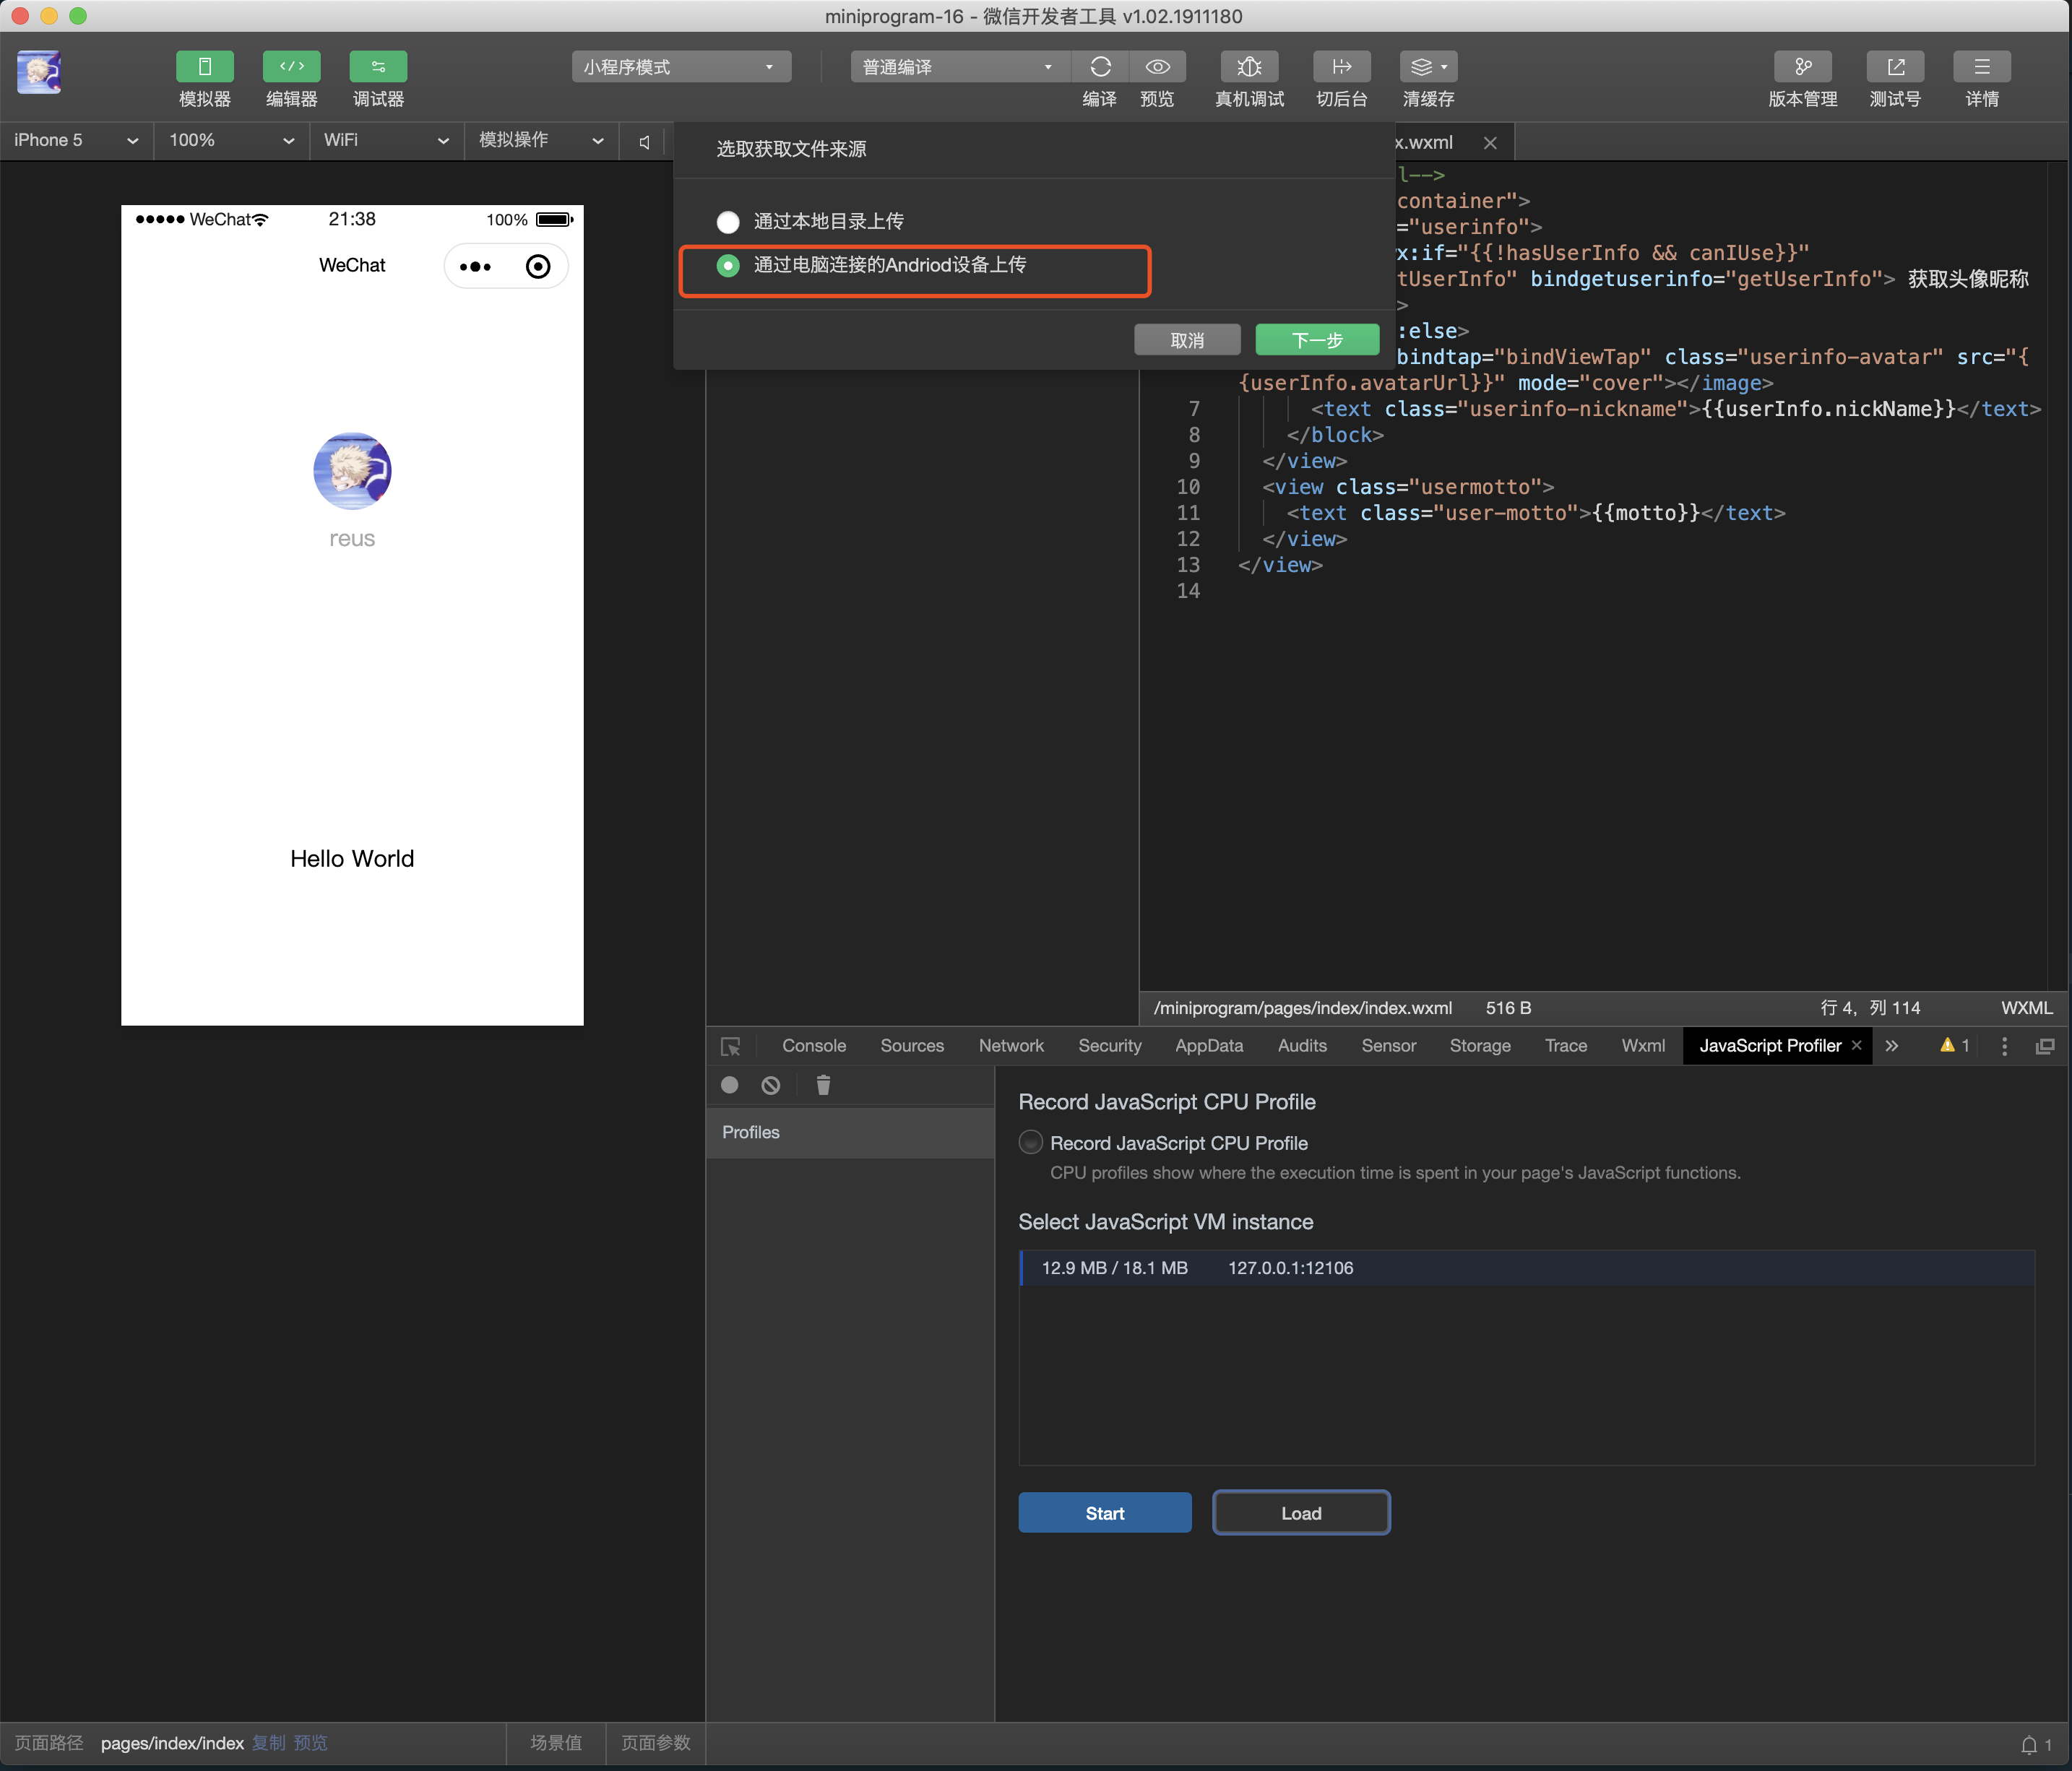
Select the Andriod device that is connected to your computer to upload.
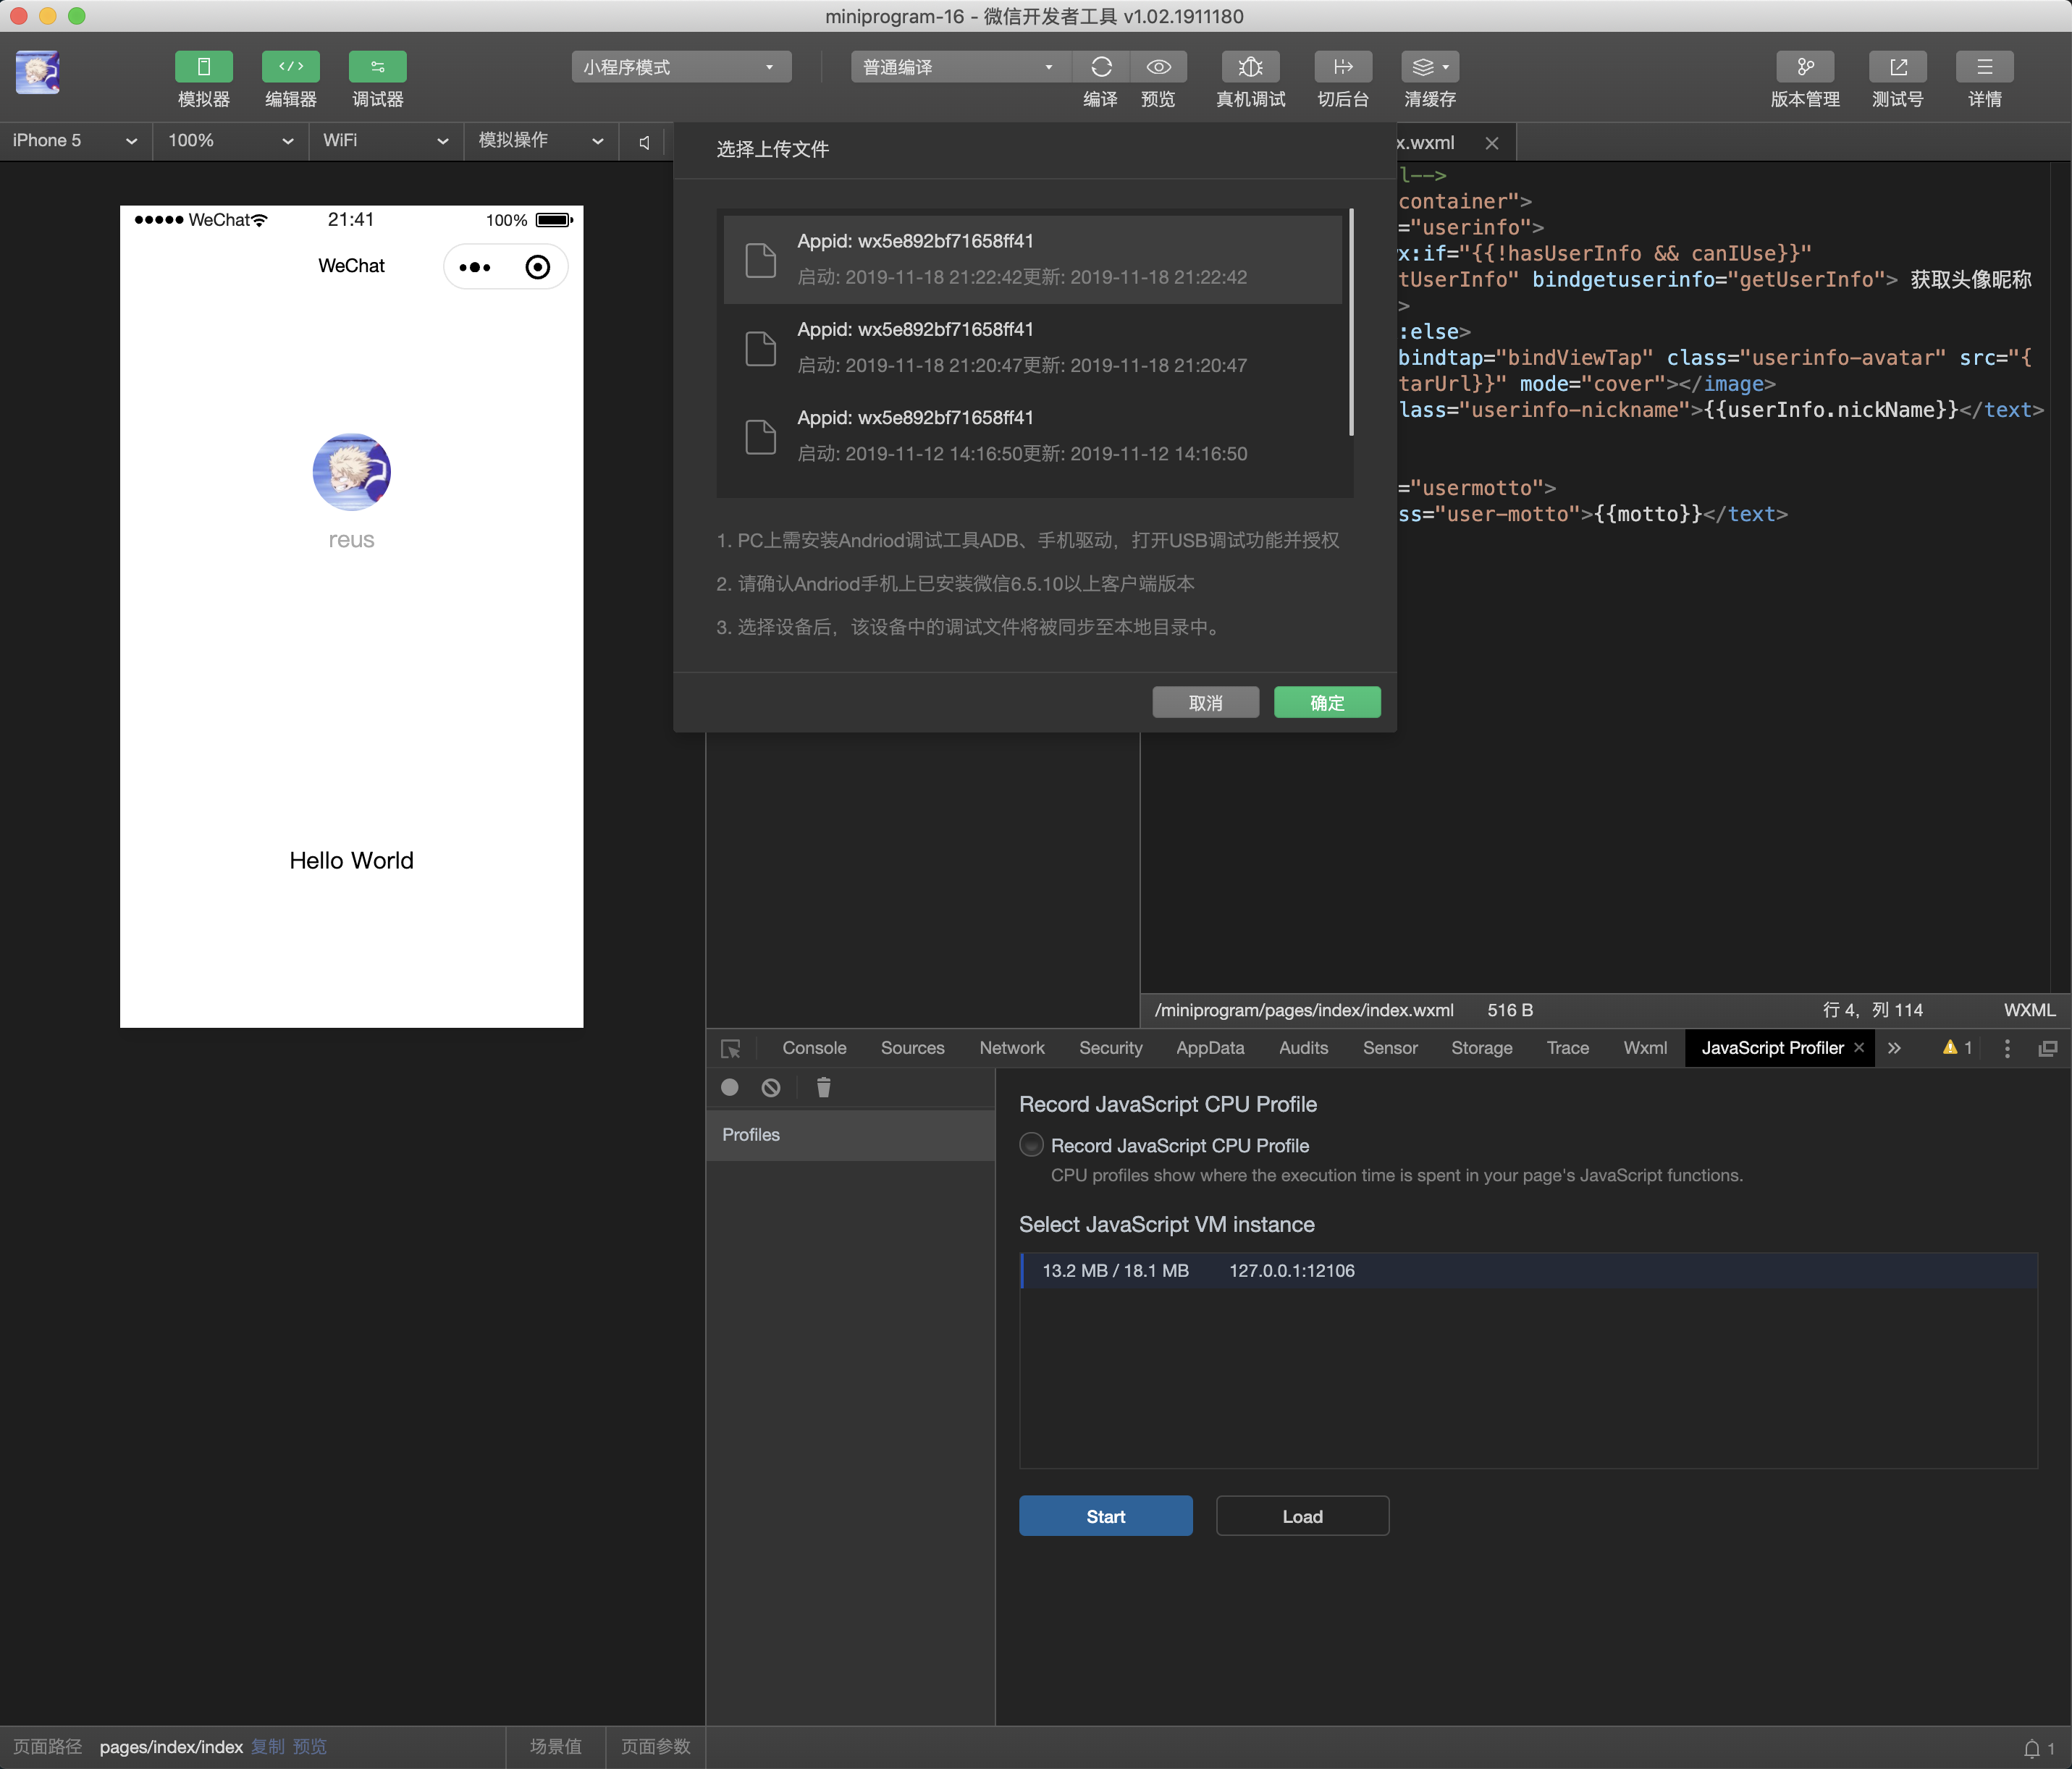
Select the device and select the corresponding file.
Click the file loaded on the left in the profiler panel to view the information.
When loading the cpuprofile file of the Andriod device, it will be stored locally in the tool. Where there is a local cpuprofile, you can directly choose to upload it through the local directory and load the local cpu profile file into the tool'sprofiler
# Note
- Make sure that the PC is installed with Andriod debugging tool ADB, mobile phone driver, turn on USB debugging function and authorize
- Please make sure that WeChat 6.5.10 or above is installed on your Andriod phone
- After selecting a device, the debugging files in that device are synchronized to the local directory
- If the device is connected to the PC, but can not search for the device, please make sure that the terminal running adb devices can show the connected device