# Debug
# vConsole
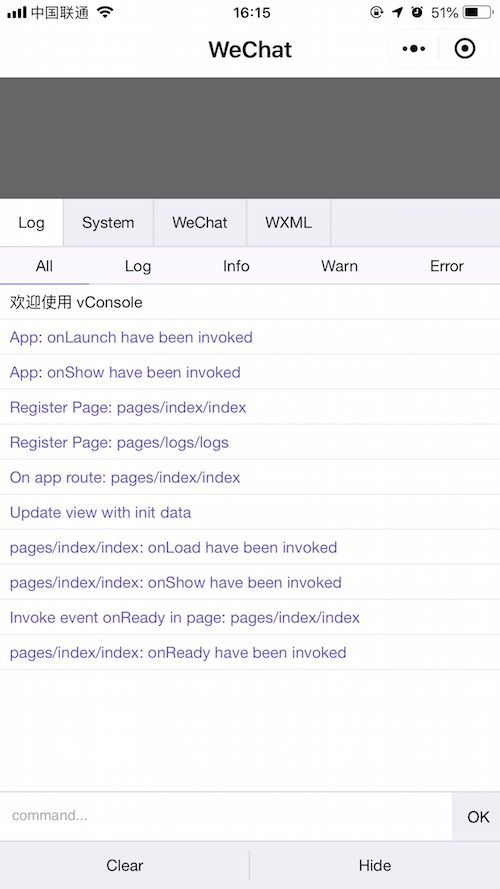
On a real device, if you want to view the log content and additional debugging information output by the console API, you need to select "Open debugging" in the menu opened by clicking the button in the upper right corner of the screen. At this time, the mini program/mini game will exit, and a vConsole button will appear in the lower right corner after reopening. Click the vConsole button to open the log panel.
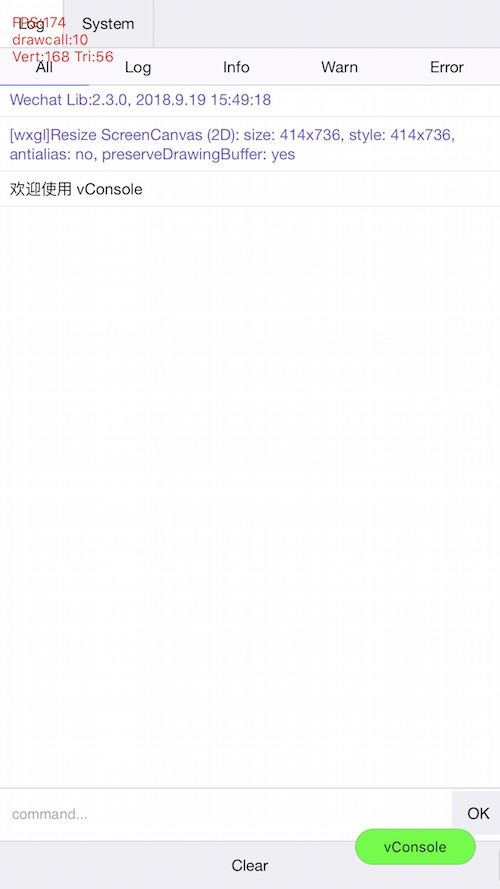
There will be a certain difference between the vConsole display content of the mini program and the mini game. The left side of the figure below is the mini program vConsole, and the right is the mini game vConsole.
# vConsole Instructions
Due to the limitation of the implementation mechanism, the log content printed by the developer calling the console API is converted into a JSON string and transmitted to vConsole, resulting in some restrictions on the content displayed in vConsole:
-Except for Number, String, Boolean, and null, all other types will be displayed as Object, printing objects and Enumerable properties in the prototype chain.
-Infinity and NaN will be displayed as null.
-undefined, ArrayBuffer, Function types cannot be displayed
-Cannot print objects with circular references
let a = {}
a.b = a
console.log(a) // Versions below 2.3.2 will print `An object width circular reference can't be logged`
In response to the above problems, the applet/game has done some processing when using vConsole
-Version 2.3.2 and above supports printing circular reference objects. Object properties of circular references will show the reference path, and @ means the object itself.
const circular = {x: {}, c: {}}
circular.x = [{ promise: Promise.resolve() }]
circular.a = circular
circular.c.x0 = circular.x[0]

console.log(circular)
// "{a:'<Circular: @>', c: {x0:'<Circular: @.x[0]>'}, x: [{promise:'<Promise>'}]}"
-Version 2.3.1 and above, supports displaying all types of data. The basic library will convert the log content once, and the converted content will be wrapped in <>. like:
-<Function: func>
-<Undefined>
-<Infinity>
-<Map: size=0>
-<ArrayBuffer: byteLength=10>
-...
-In version 2.2.3 ~ 2.3.0, ArrayBuffer and Function types can be displayed, and undefined will be printed as a string 'undefined'
**Note: Try to avoid printing log content that is too complex or too long in non-debugging situations (such as sprites or material objects in the game engine), which may cause additional time-consuming. **
# Source Map
Currently only supported on iOS 6.7.2 and above
When the mini program/mini game is packaged, all the js code will be packaged into one file. In order to facilitate the developer to locate the wrong location when debugging on the mobile phone, the mini program/mini game provides [Source Map](https://docs. google.com/document/d/1U1RGAehQwRypUTovF1KRlpiOFze0b-_2gc6fAH0KY0k/edit) support.
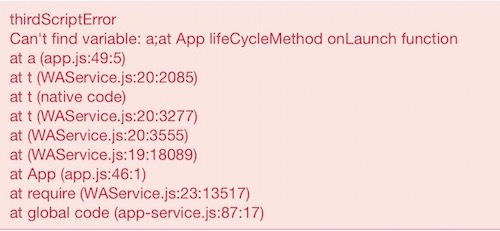
When you turn on ES6 to ES5 and code compression in the developer tools, a source map .map file will be generated. Development version Mini Program, the basic library will use the .map file in the code package to remap the error message stack displayed in vConsole (only for developer code files).
If you use an external compilation script to process the source file, you only need to place the generated Source Map file in the same directory as the source file
like:
pages/index.js
pages/index.js.map
app.js
app.js.map
The developer tools will read, parse the Source Map file, and upload it
Later, you can use the uploaded Source Map file for error analysis in the operation center in the background of the applet
- **Source Map files are not included in the code package size calculation. **
- **Due to the
.mapfile included in the development version code package, the actual code package size will be larger than the trial version and the official version. **
# Real machine debugging
The remote debugging function of the real machine can directly use the developer's tools to debug the small programs running on the mobile phone through the network connection, and help the developer to better locate and find the problems on the mobile phone. For details, please refer to the development tool documentation Real machine debugging