# Developer Tools "Emulator" and "Debugger"
The simulator and debugger of the WeChat developer tool helps developers use the tools to simulate the performance of Weixin Mini Program, including the ability to perform performance analysis.
Developer Tools required. 1.05.2201240 and above support
# Logical Layer JavaScript Profile
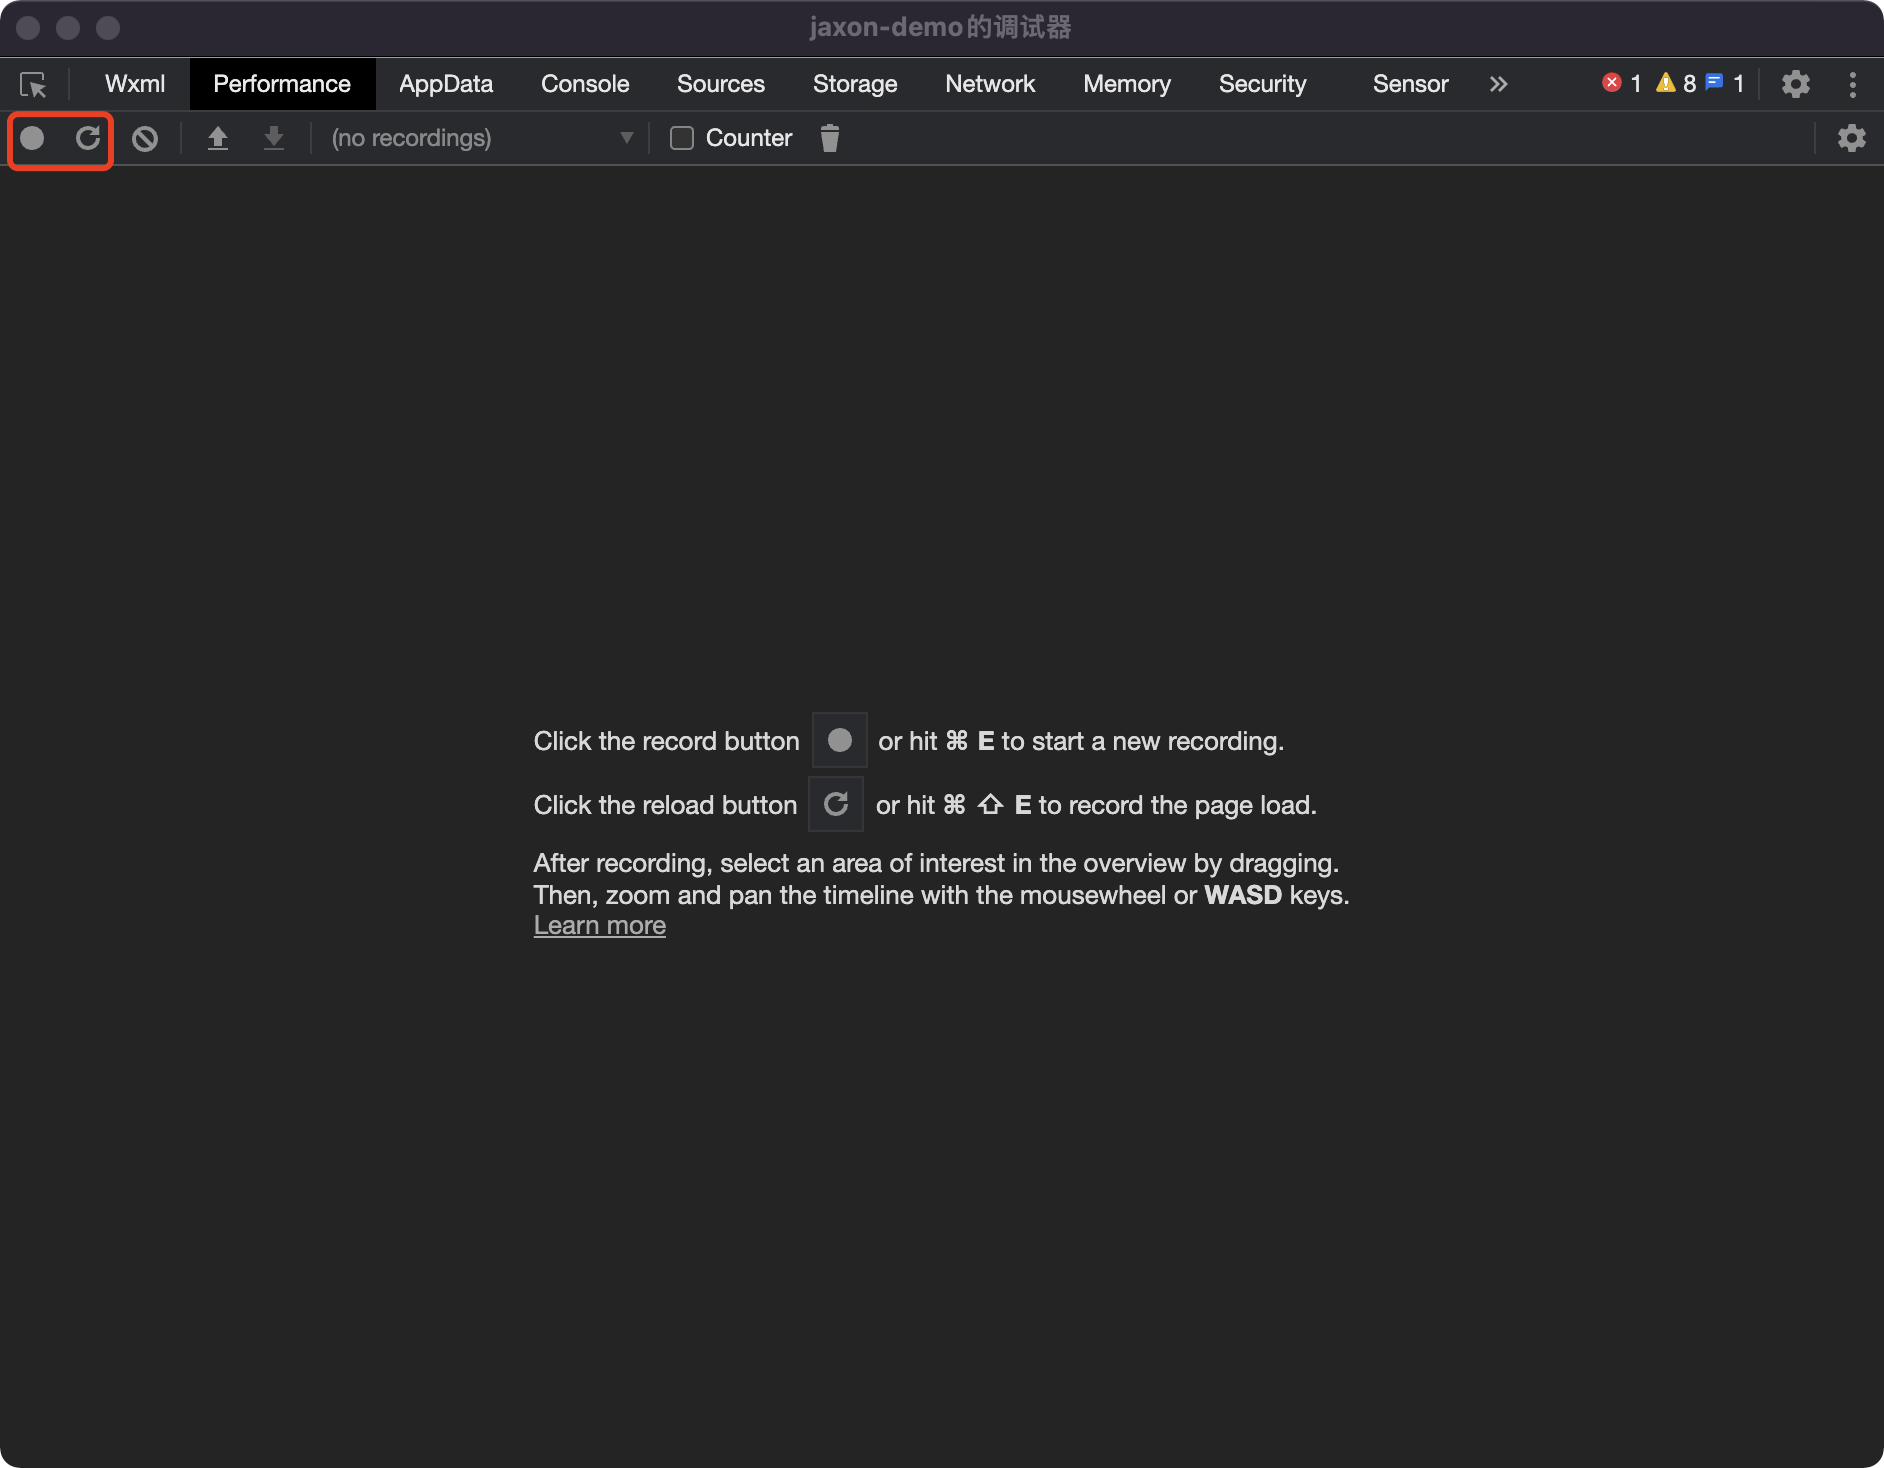
Developers can use the "Performance" or "JavaScript Profiler" panels in the "Mimic" to analyze the JS execution of the Weixin Mini Program logical layer.
To analyze the Weixin Mini Program code injection during startup, click the second reload button in the upper left corner of "Performance."

Detailed instructions can be found in Chrome's "Performance," "JavaScript Profiler" panels.
# Logical layer memory debugging
Similar to real-world debugging 2.0, developers can use the memory panel in the emulator to get a snapshot of the JS heap memory of the Weixin Mini Program logic layer, analyze the memory distribution, and detect memory leaks.


Detailed instructions can be found in Chrome's "Memory" panel.
# View layer debugging
Need latest tools nightly version support
Developers can open the view layer of the current page at the bottom of the emulator to debug the tool.In the tool, you can debug the performance of the Weixin Mini Program view layer through the "Performance," "memory," "Layer," "Rendering" panels.

Detailed instructions can be found in the corresponding Chrome panel
# Low-end machine simulation
Developers can open the "low-end machine simulation" in the emulator, and the developer tool will limit CPU usage to simulate the low-end machine experience.
