# Real-world debugging 2.0
The real-world debugging 2.0 feature of the WeChat developer tool allows developers to use the tools to debug Weixin Mini Program performance on real-world machines, including the ability to perform performance analysis.Open real debugging 2.0 steps, please refer to "real debugging 2.0 documentation" .
# Memory debugging
Only Android devices are supported
Developers can use the "memory" panel to get a snapshot of the JS heap memory at the logical layer, analyze the memory distribution, and troubleshoot internal storage leaks.

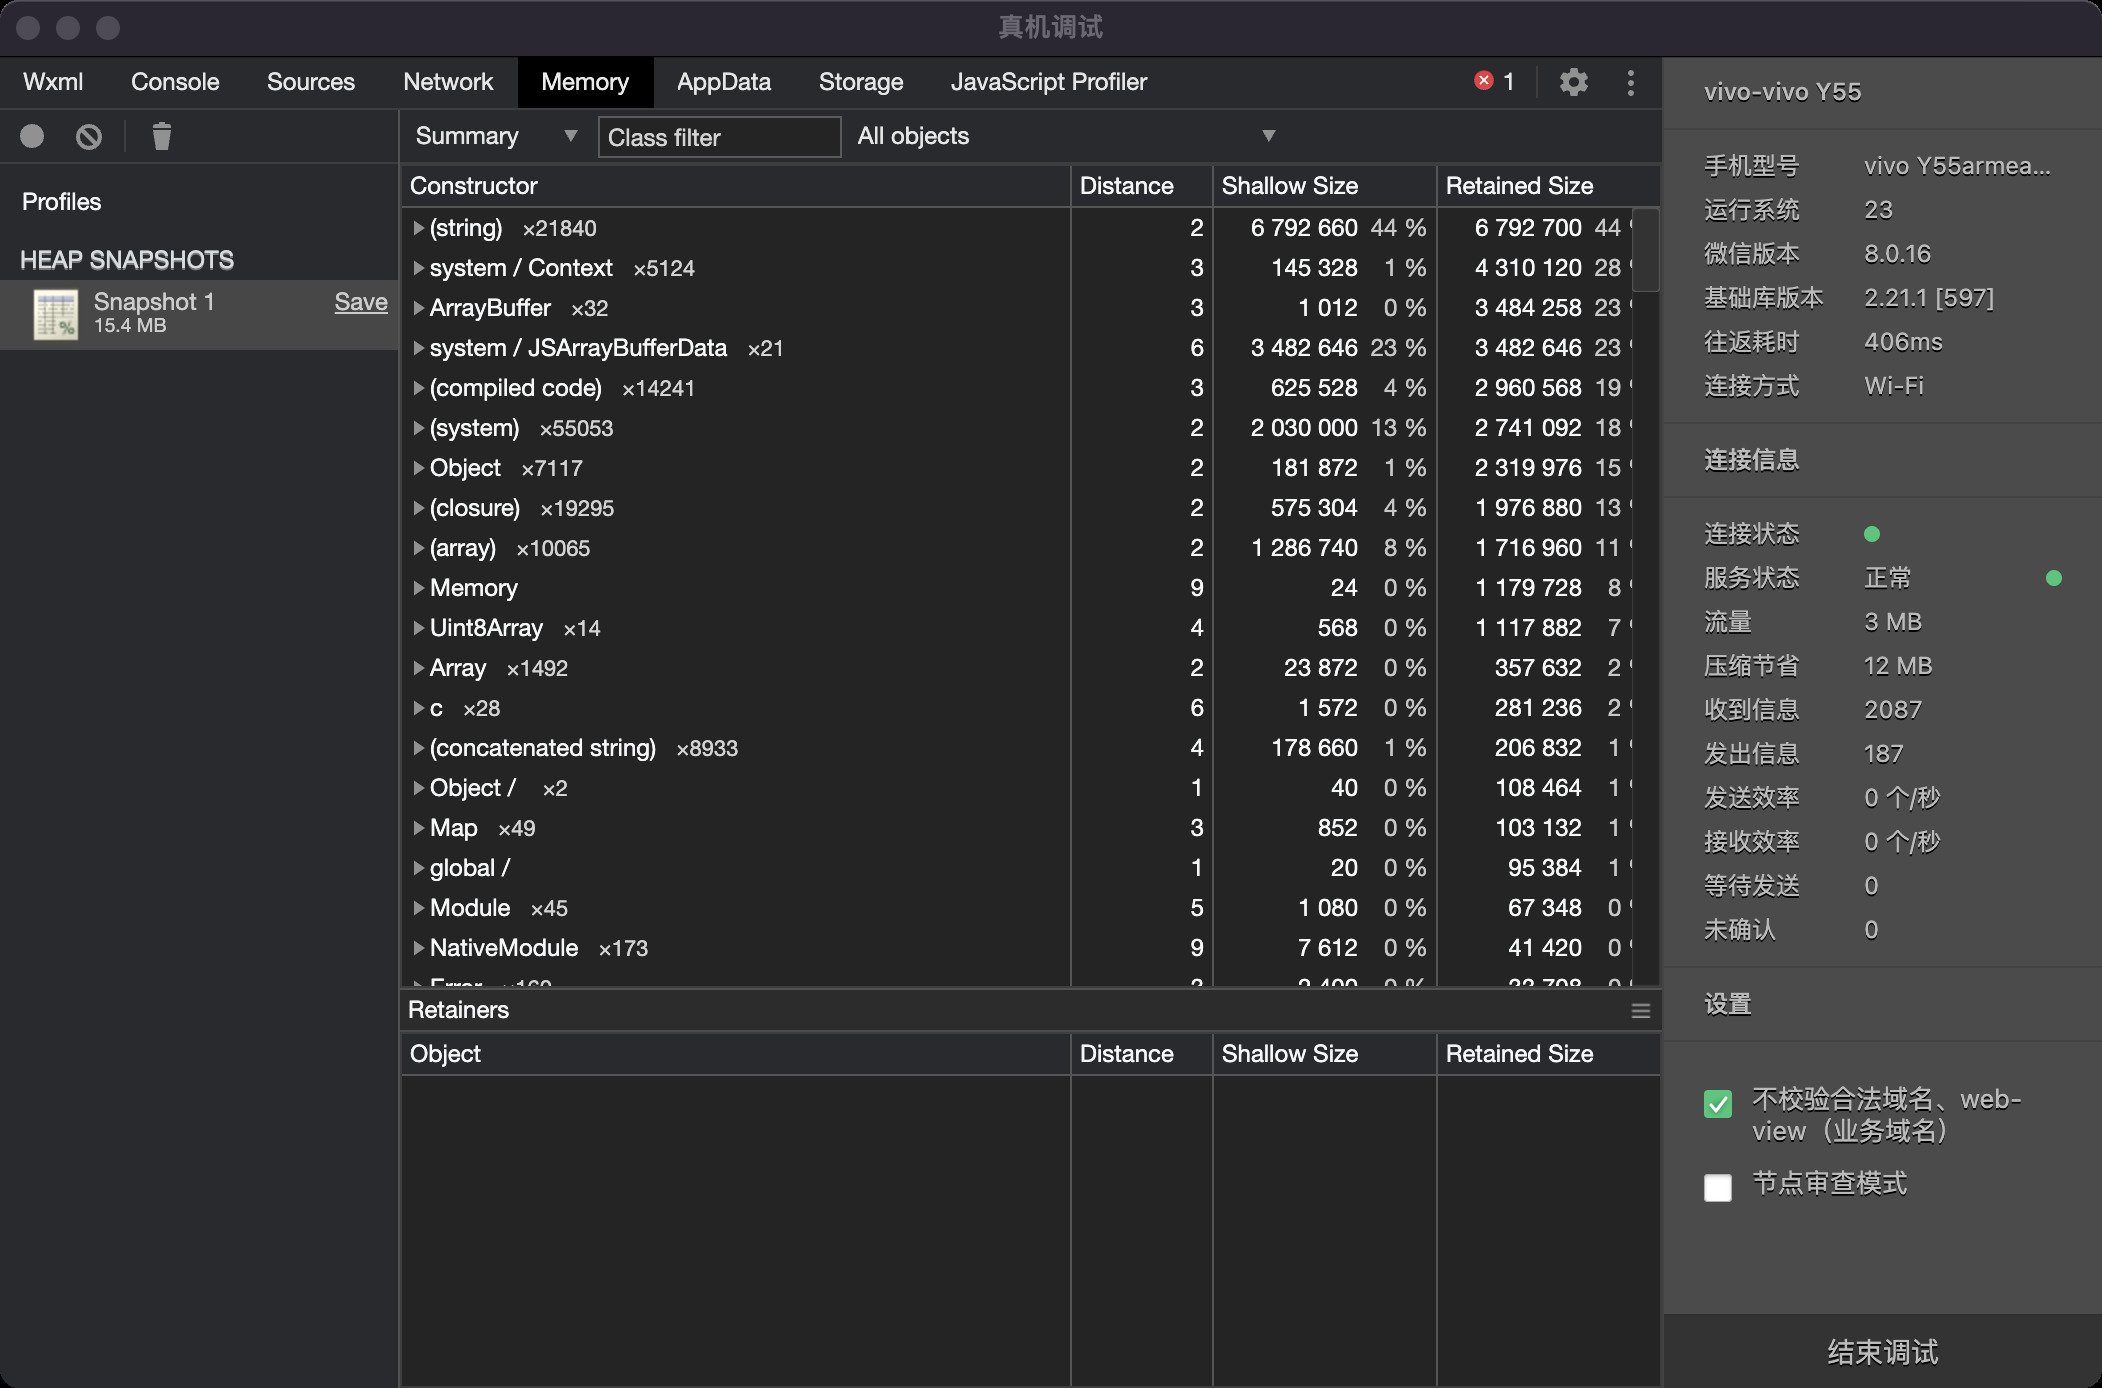
Detailed instructions can be found in Chrome's "Memory" panel.
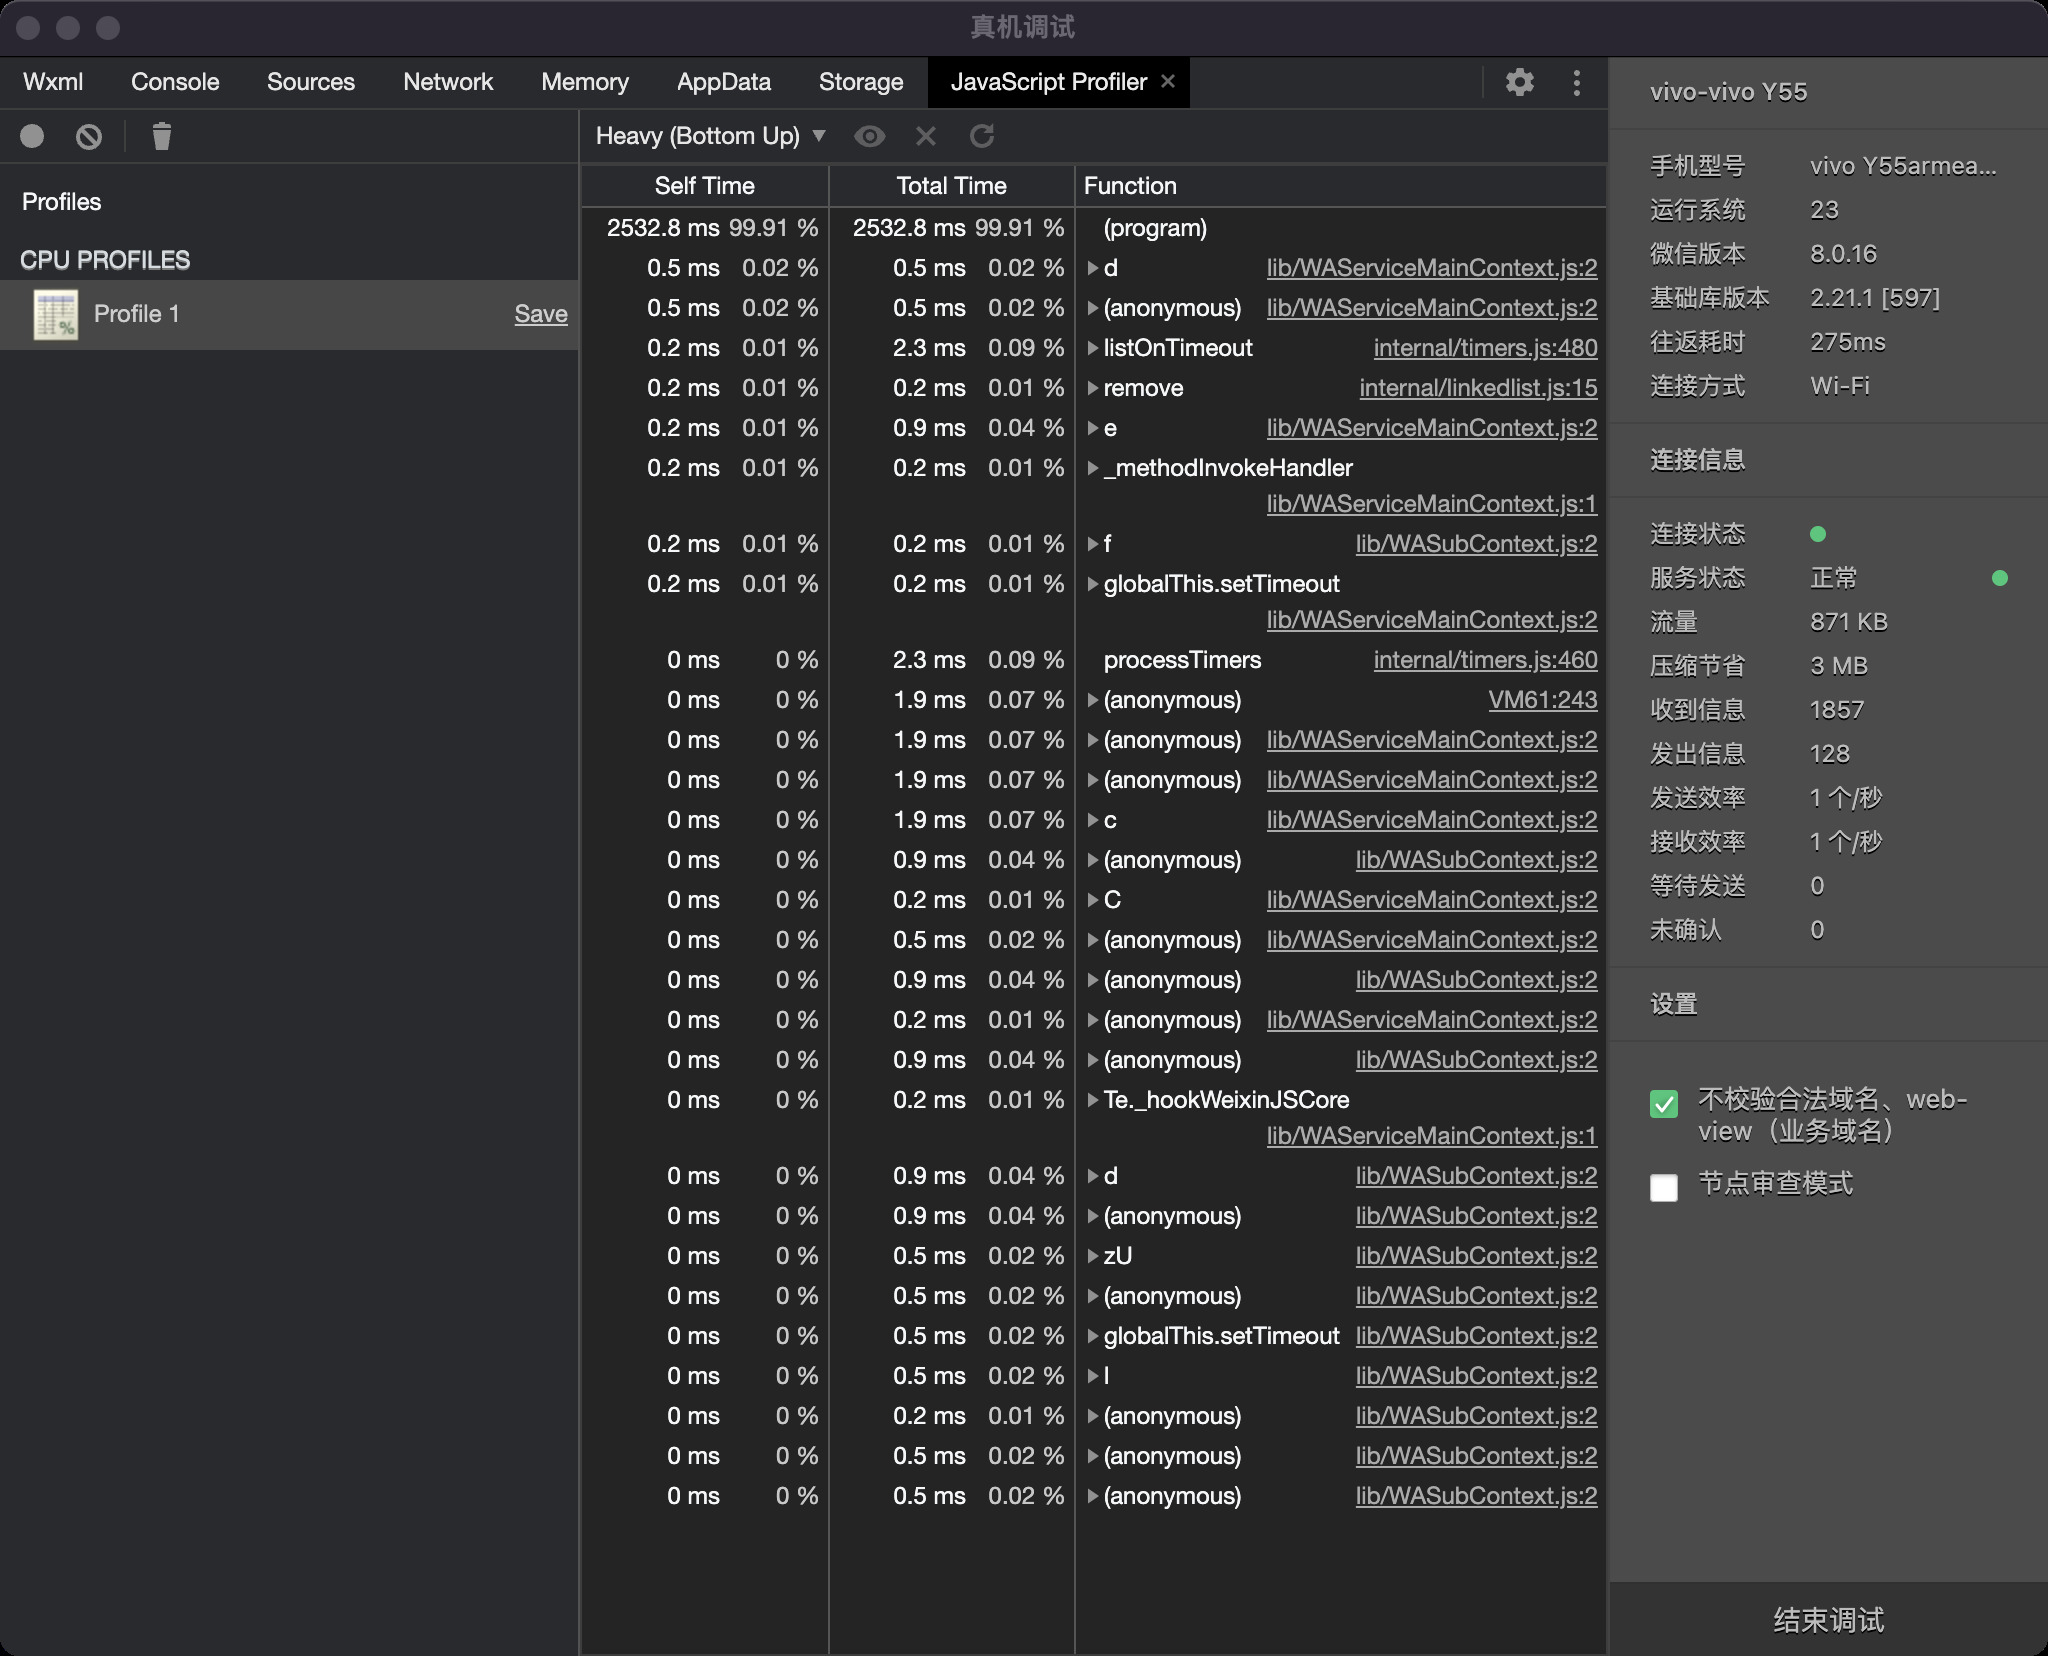
# JavaScript Profiler
Only Android devices are supported
Developers can use the "JavaScript Profiler" panel to analyze the JS execution of the Weixin Mini Program logical layer. If you want to analyze the case of Mini Program code injection during startup, you can use thedebuggerbreakpoint in your code.
// app.js
debugger

App({
  onLaunch() {}
})

Detailed instructions can be found in Chrome's JavaScript Profiler panel.