# Performance diagnostic tools
# Introduction
To help developers better detect performance and experience issues in Weixin Mini Program, we launchedWeixin Mini Program performance diagnostic tool.
The diagnostic tool detects Weixin Mini Program in terms of startup performance, skipping performance, best practices, operating experience, and network performance, and gives targeted optimization recommendations, with some indicators attempting to give an estimated optimization space.
# How to use it
Operating environment requirements:
- The base library uses version 3.7.0 and above
- IOS Passenger Version > = 8.0.54
- Android Guest Version > = 8.0.55
- Developer Tools Nightly > = 1.06.2411272
Development / Experience VersionWeixin Mini Program You can open the diagnostic tool from the Mini Program menu. It is not supported in the official version.
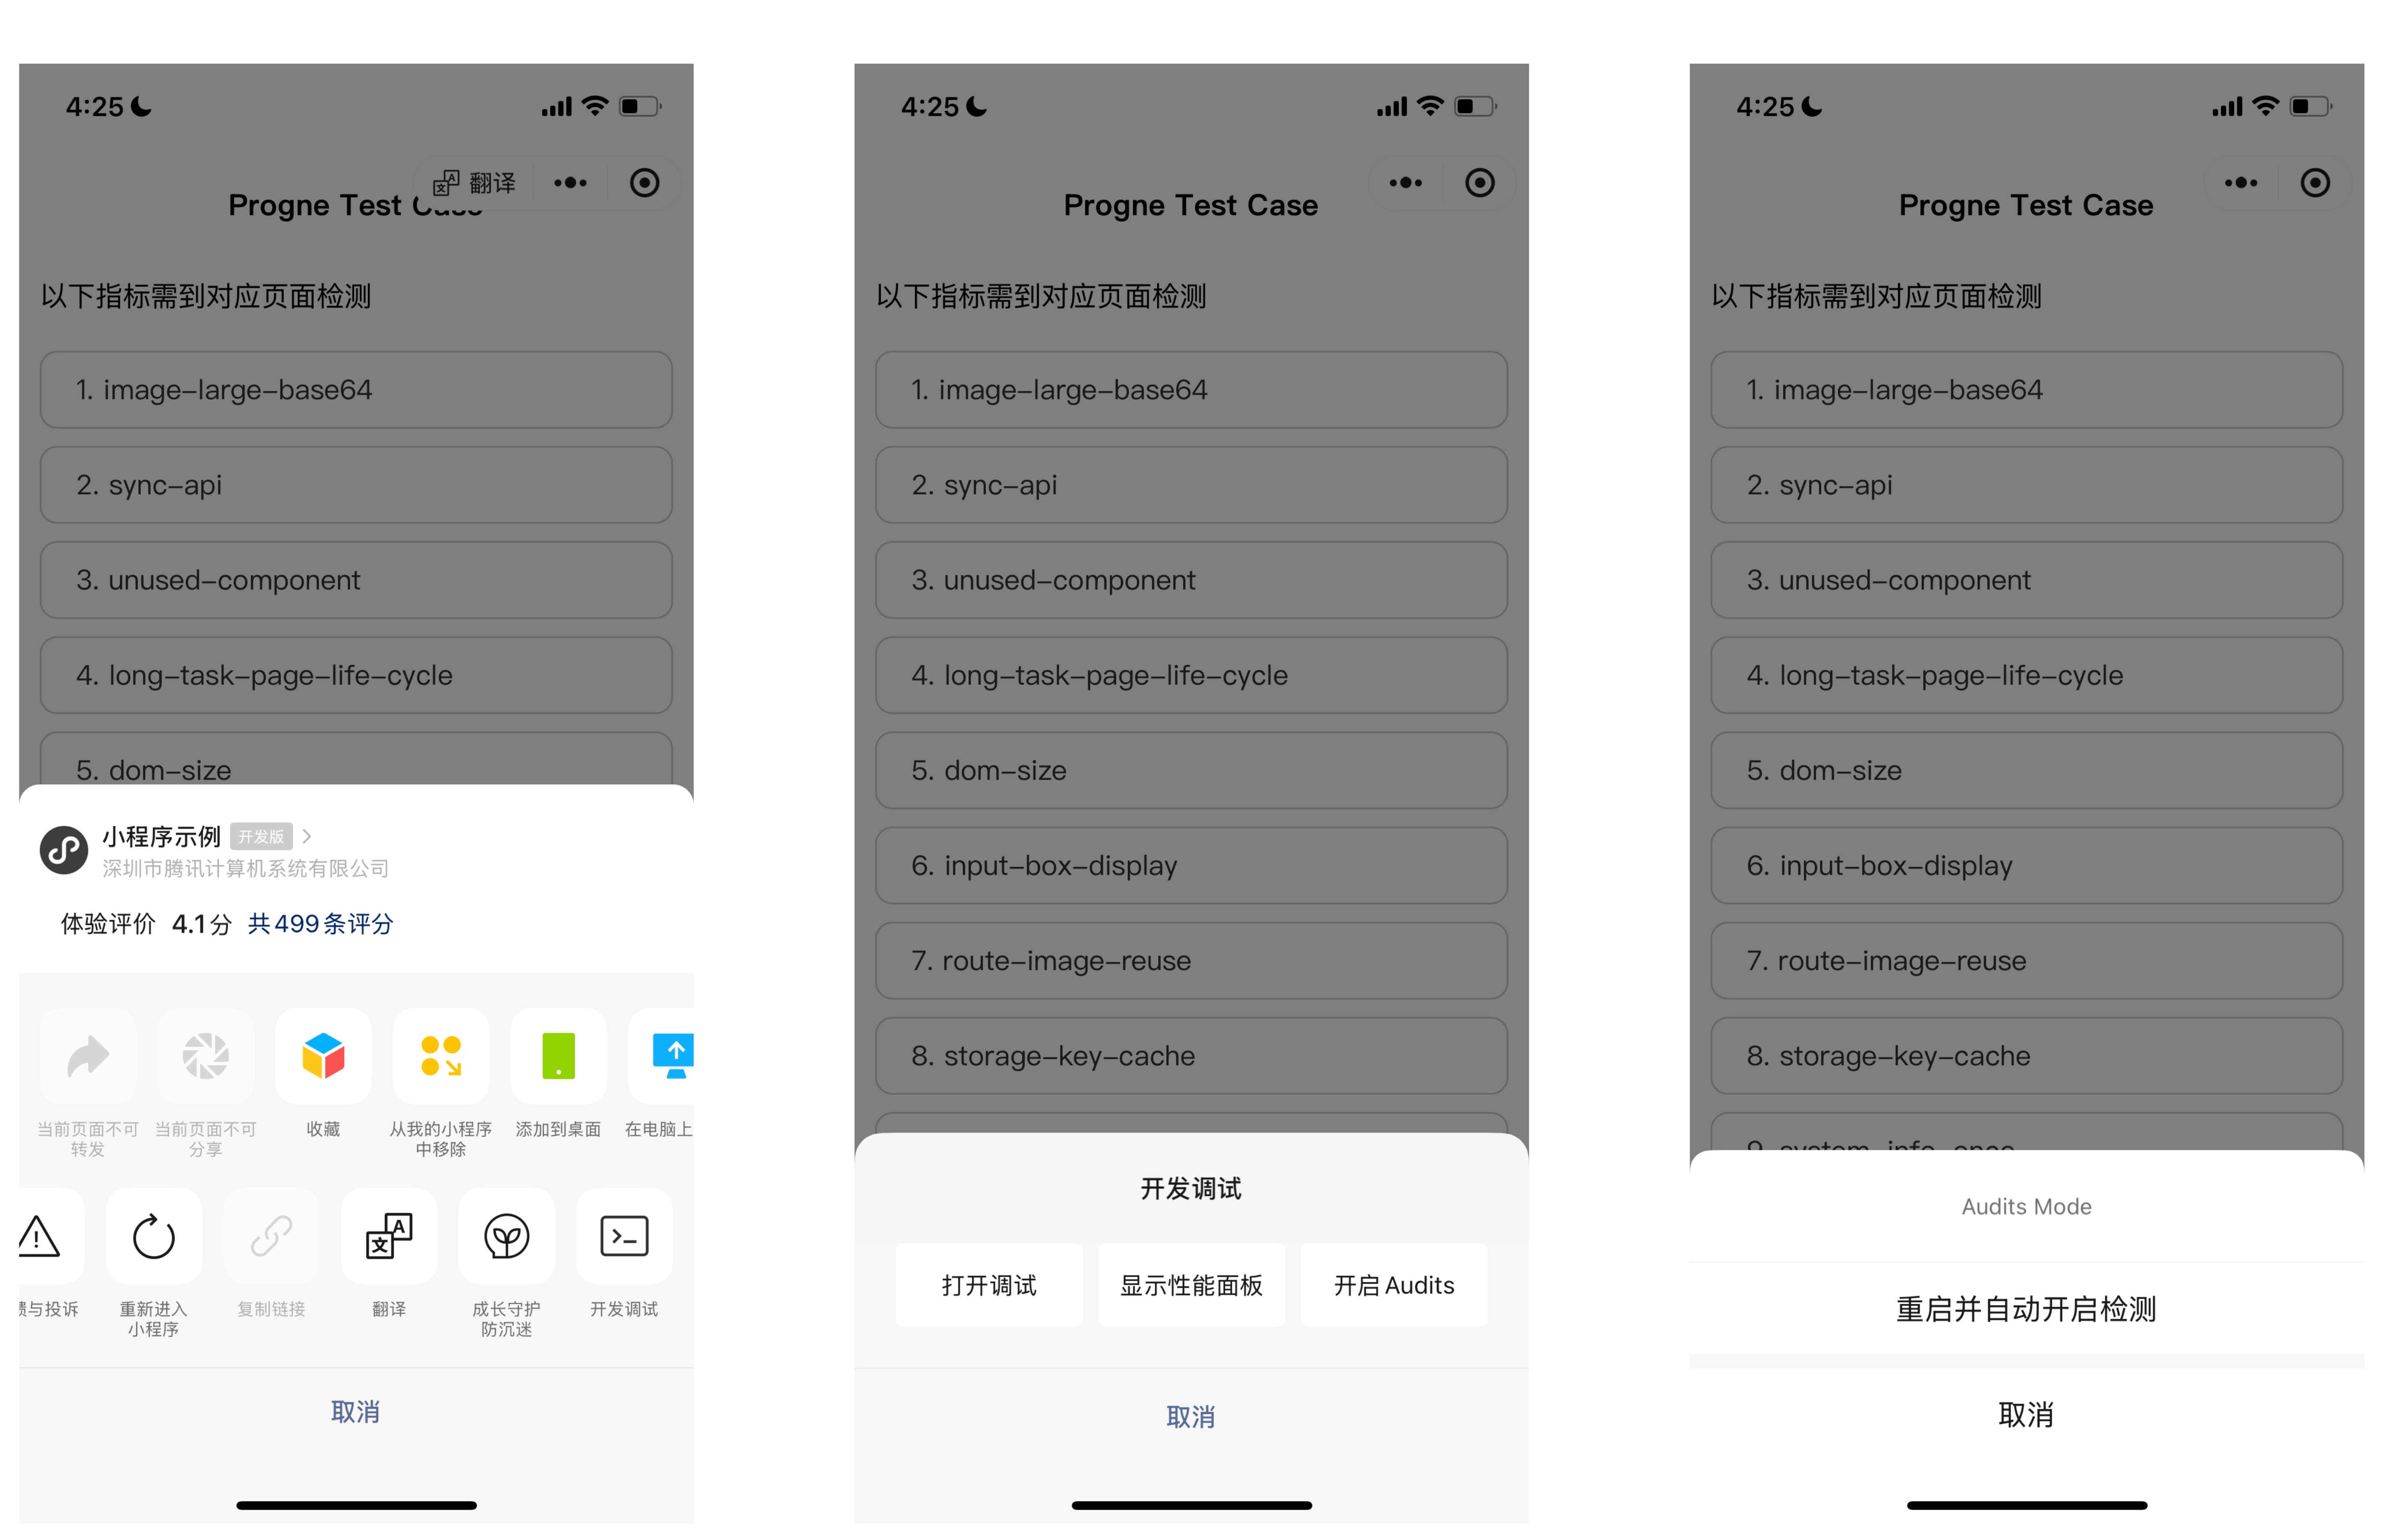
- Top right menu - Development and debugging - Open Audits - Restart and automatically open detection
Will automatically close the current Weixin Mini Program, the next time it is opened, it will automatically detect, and the "detection" logo appears in the page.Go to the page that needs to be detected and manipulate the Mini Program.
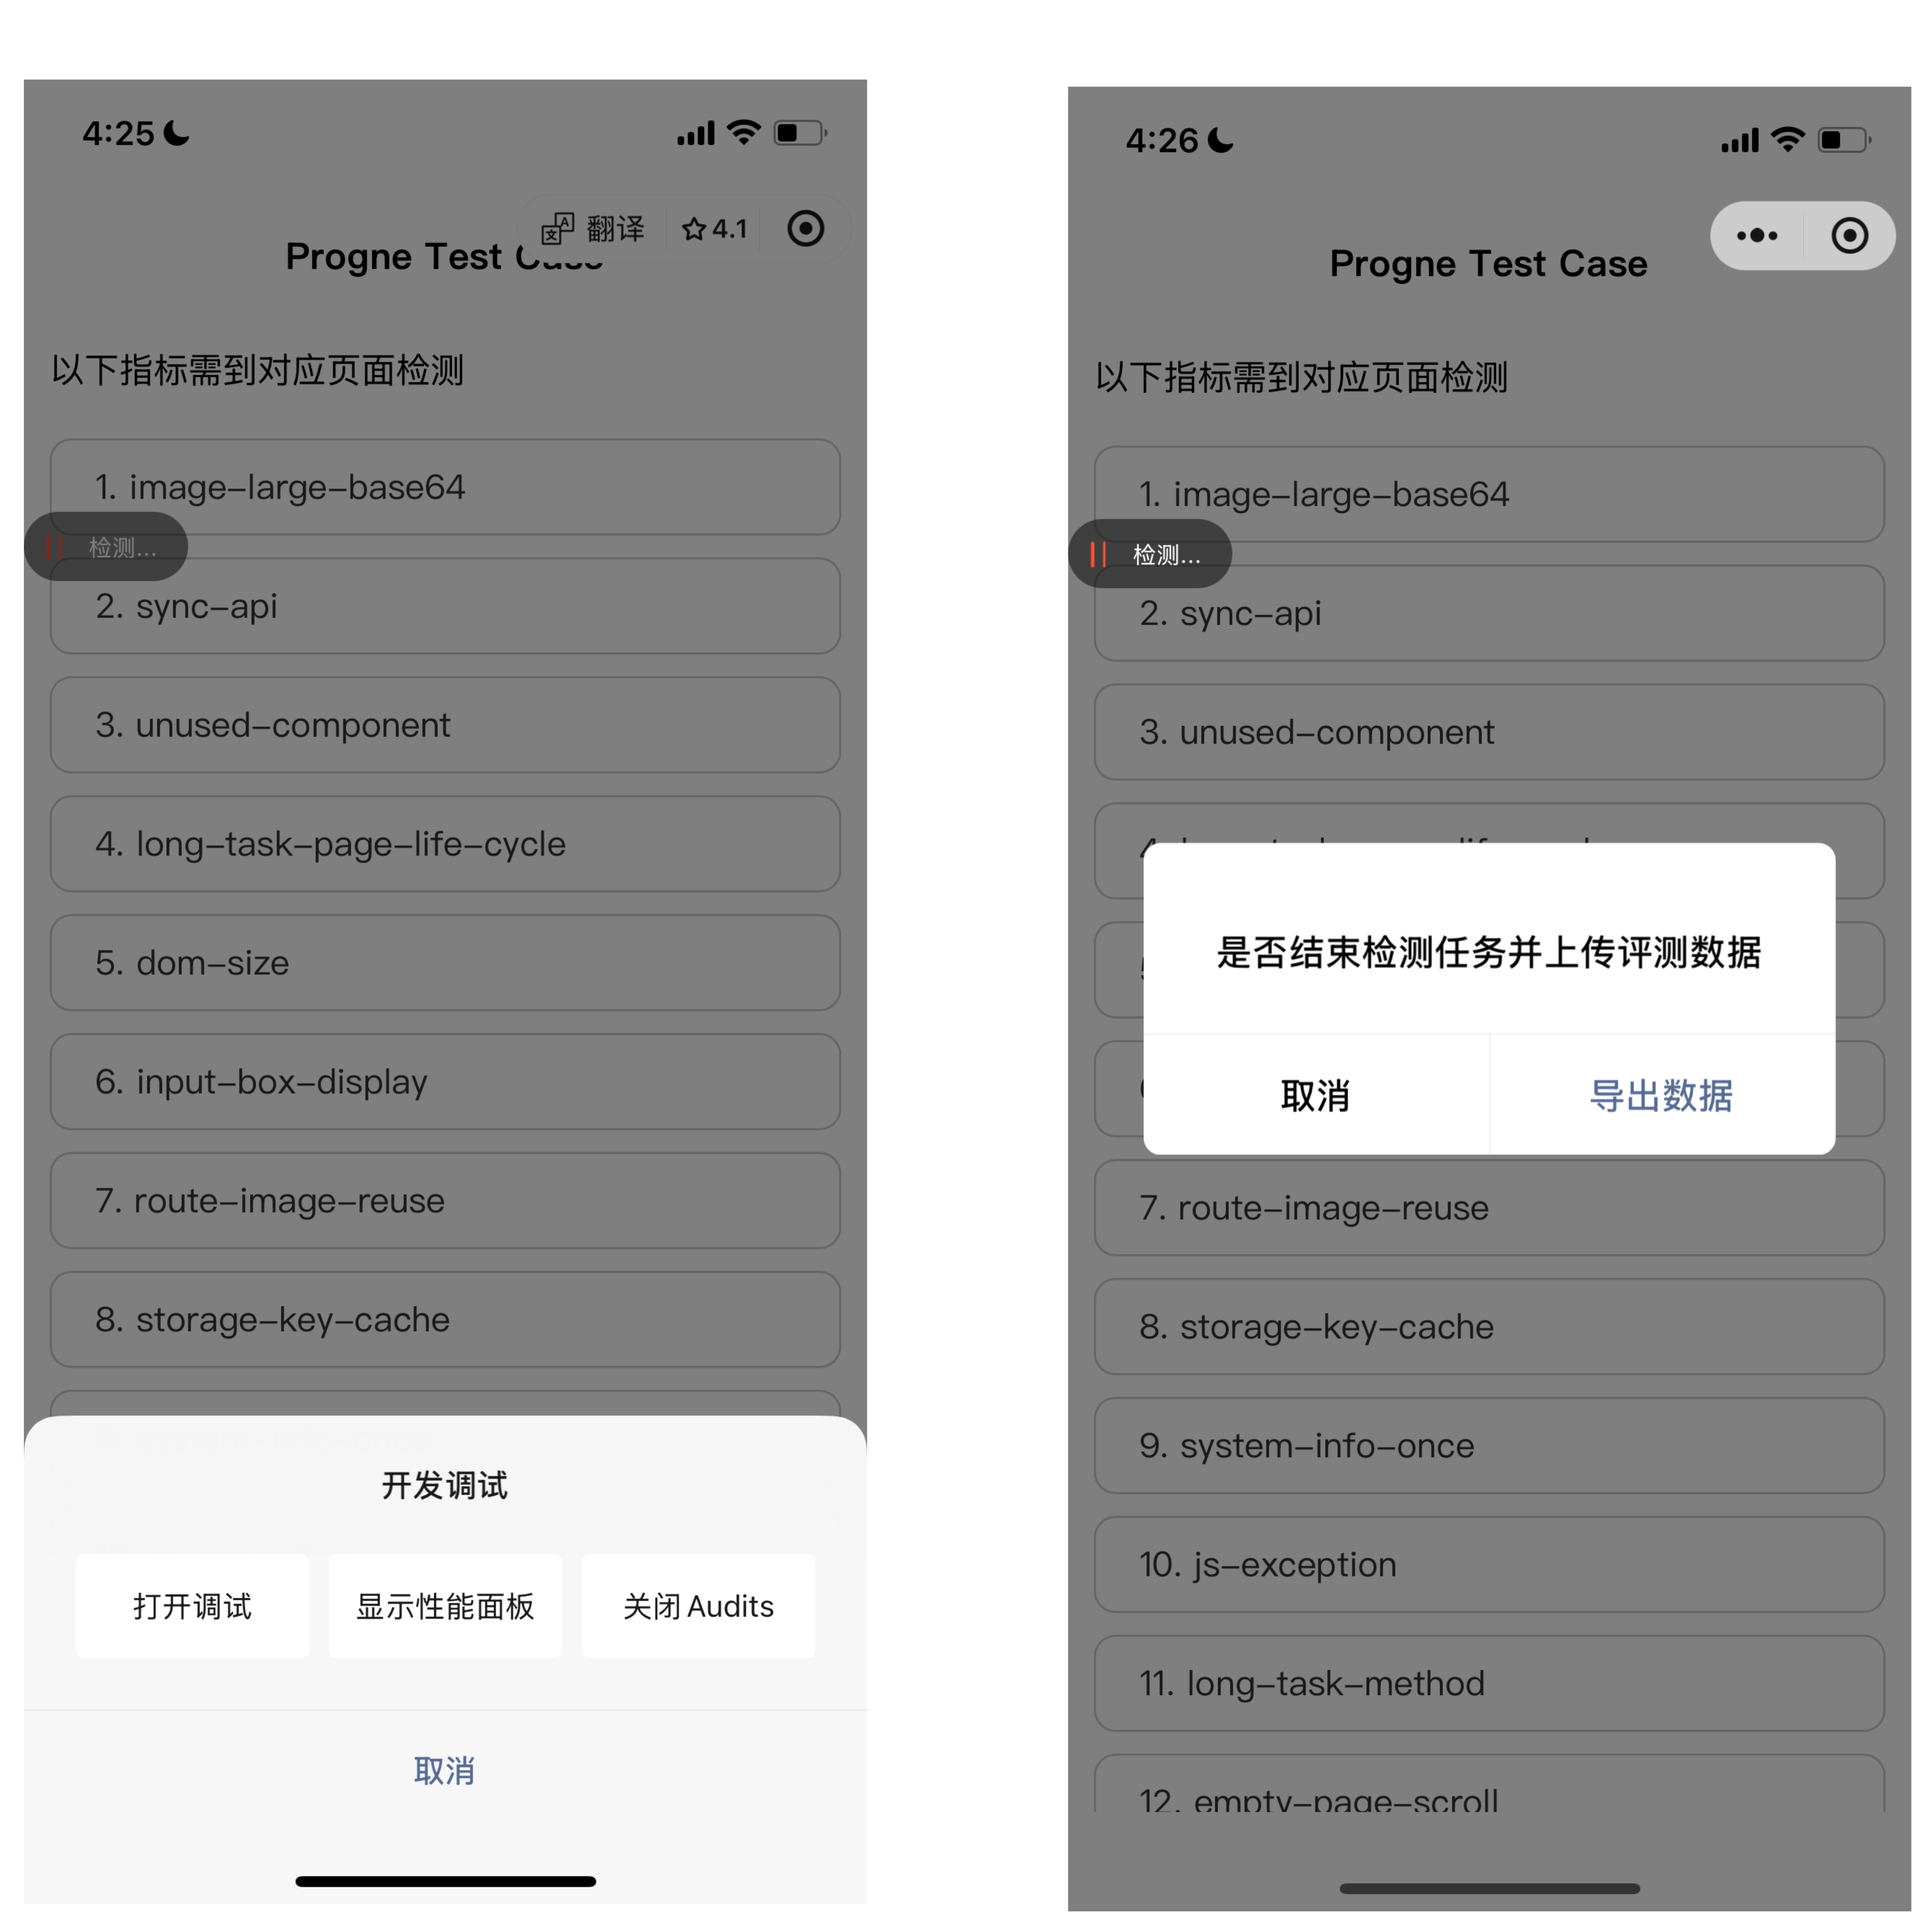
- Top right menu - Develop and debug - Close Audits
There is the end of the task pop-up, click on the export data to share the json file to WeChat.
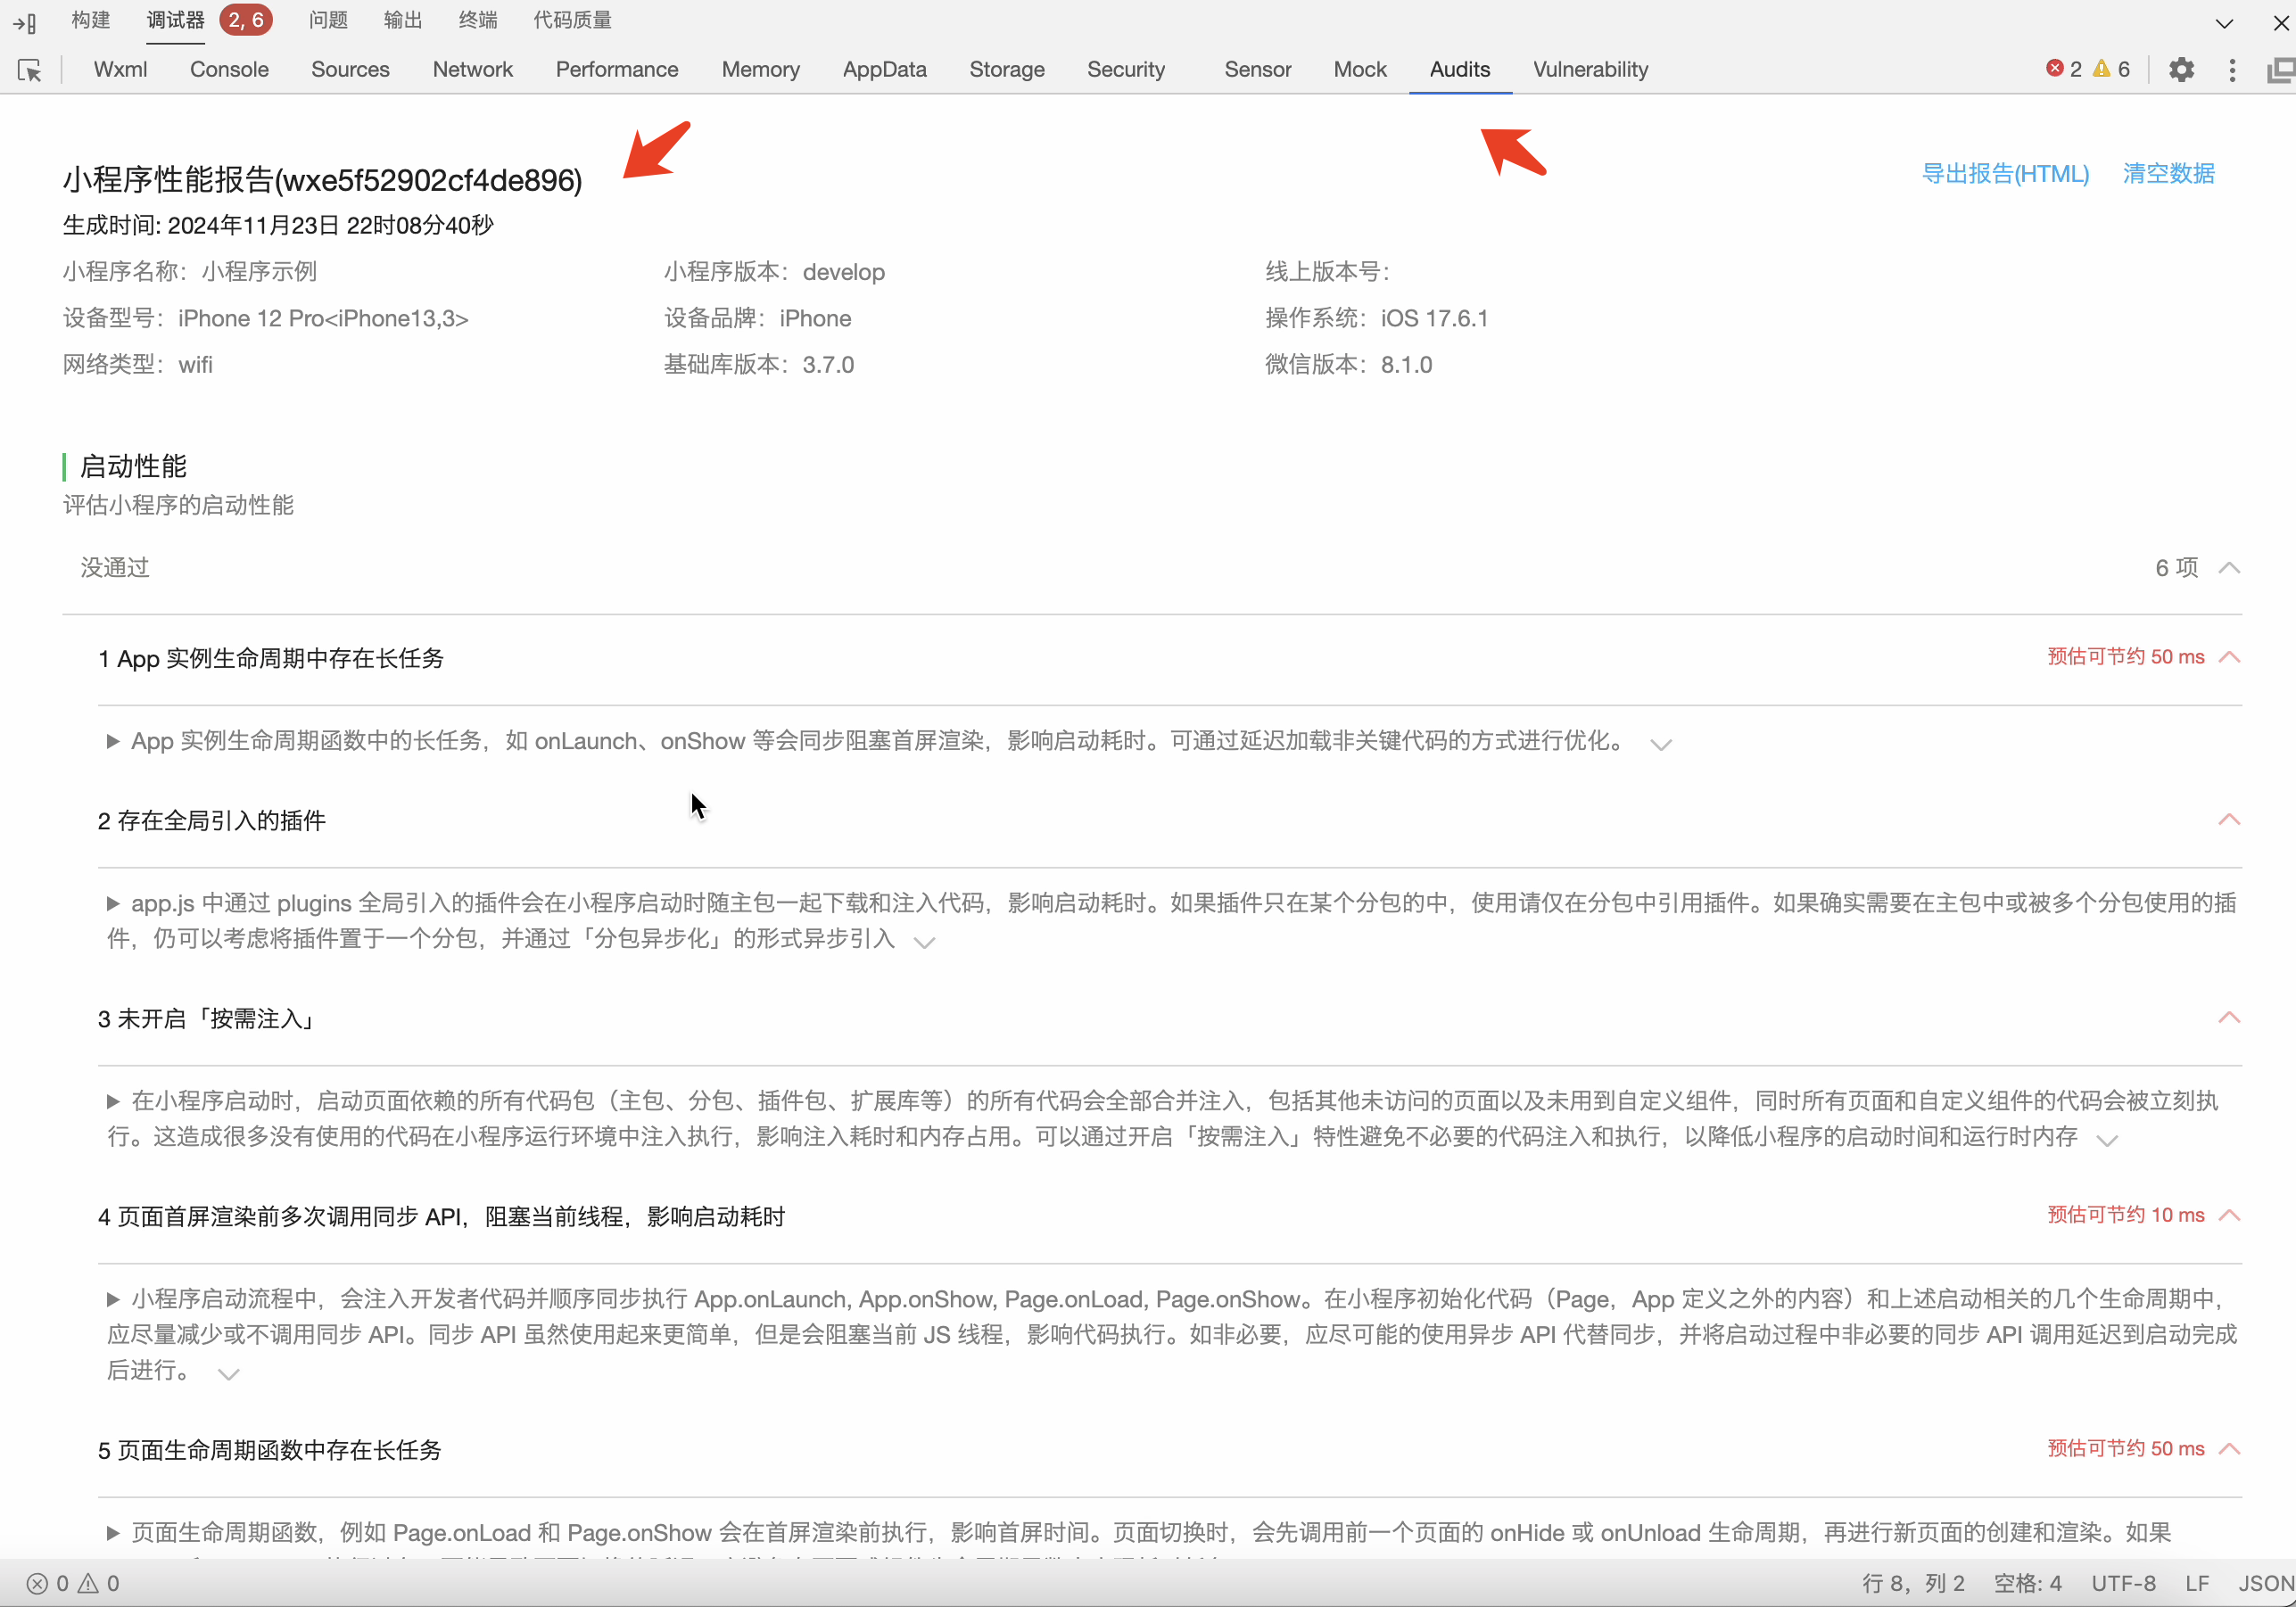
- Drag the exported json file to the Developer Tools Audits panel for visualization
# Note
- The diagnostic tool only loads the relevant code after activation and detects the
development / experience version; the official version does not take effect even after activation. - A diagnostic tool is a runtime detection that relies on a developer's operating path, and developers should be likely to operate critical paths to trigger actions such as page scrolling, rolling, and so on.
- The diagnostic tool is an upgrade to the experience score. A small number of indicators overlap, and the diagnostic tool is dedicated to giving specific optimizable recommendations.